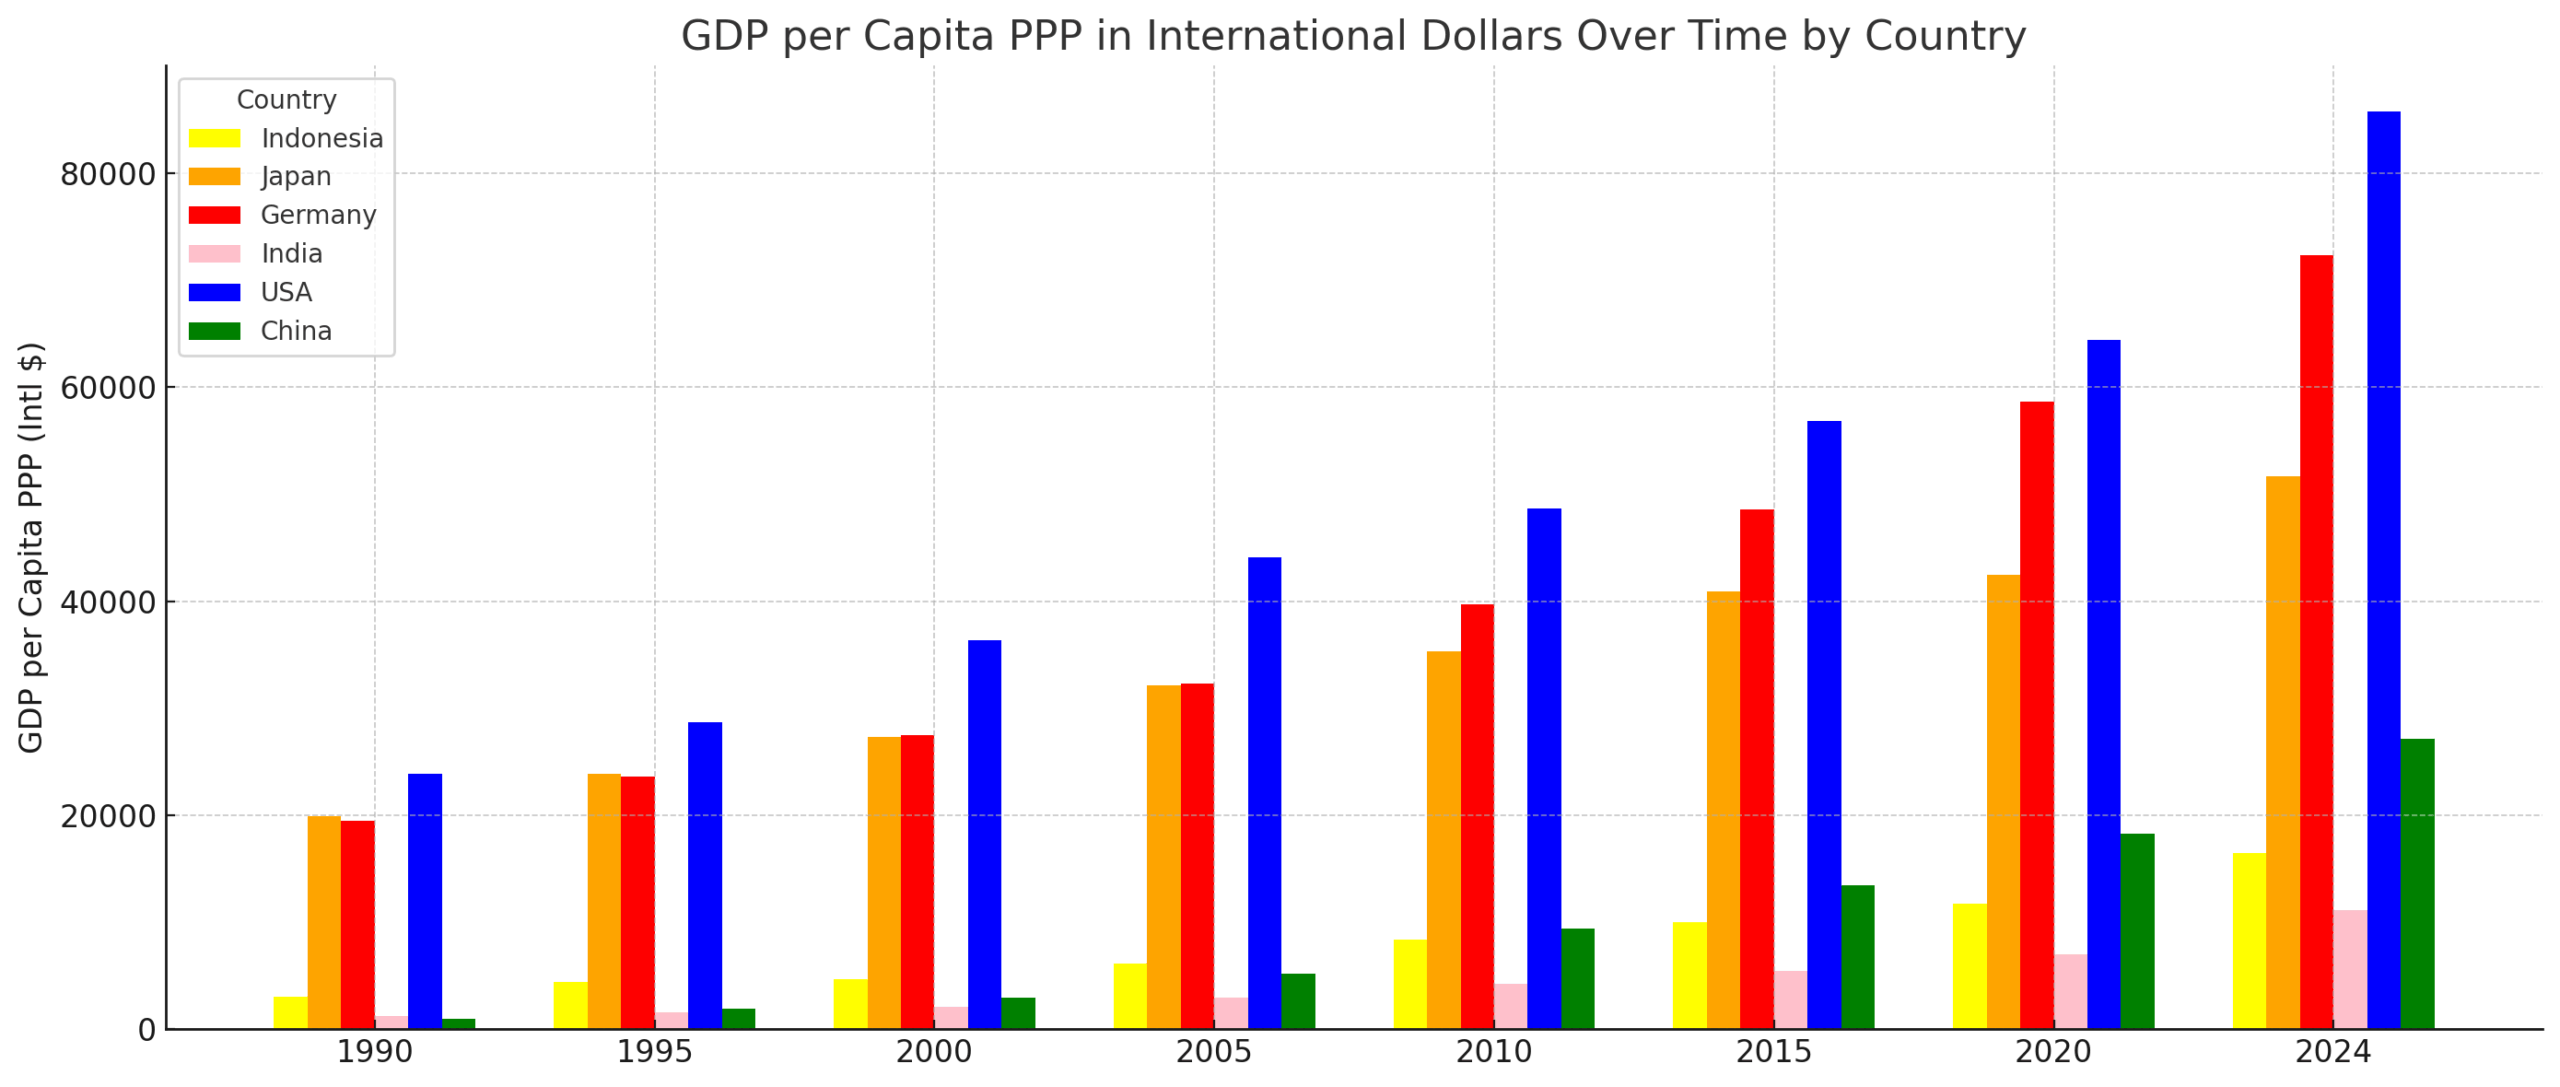
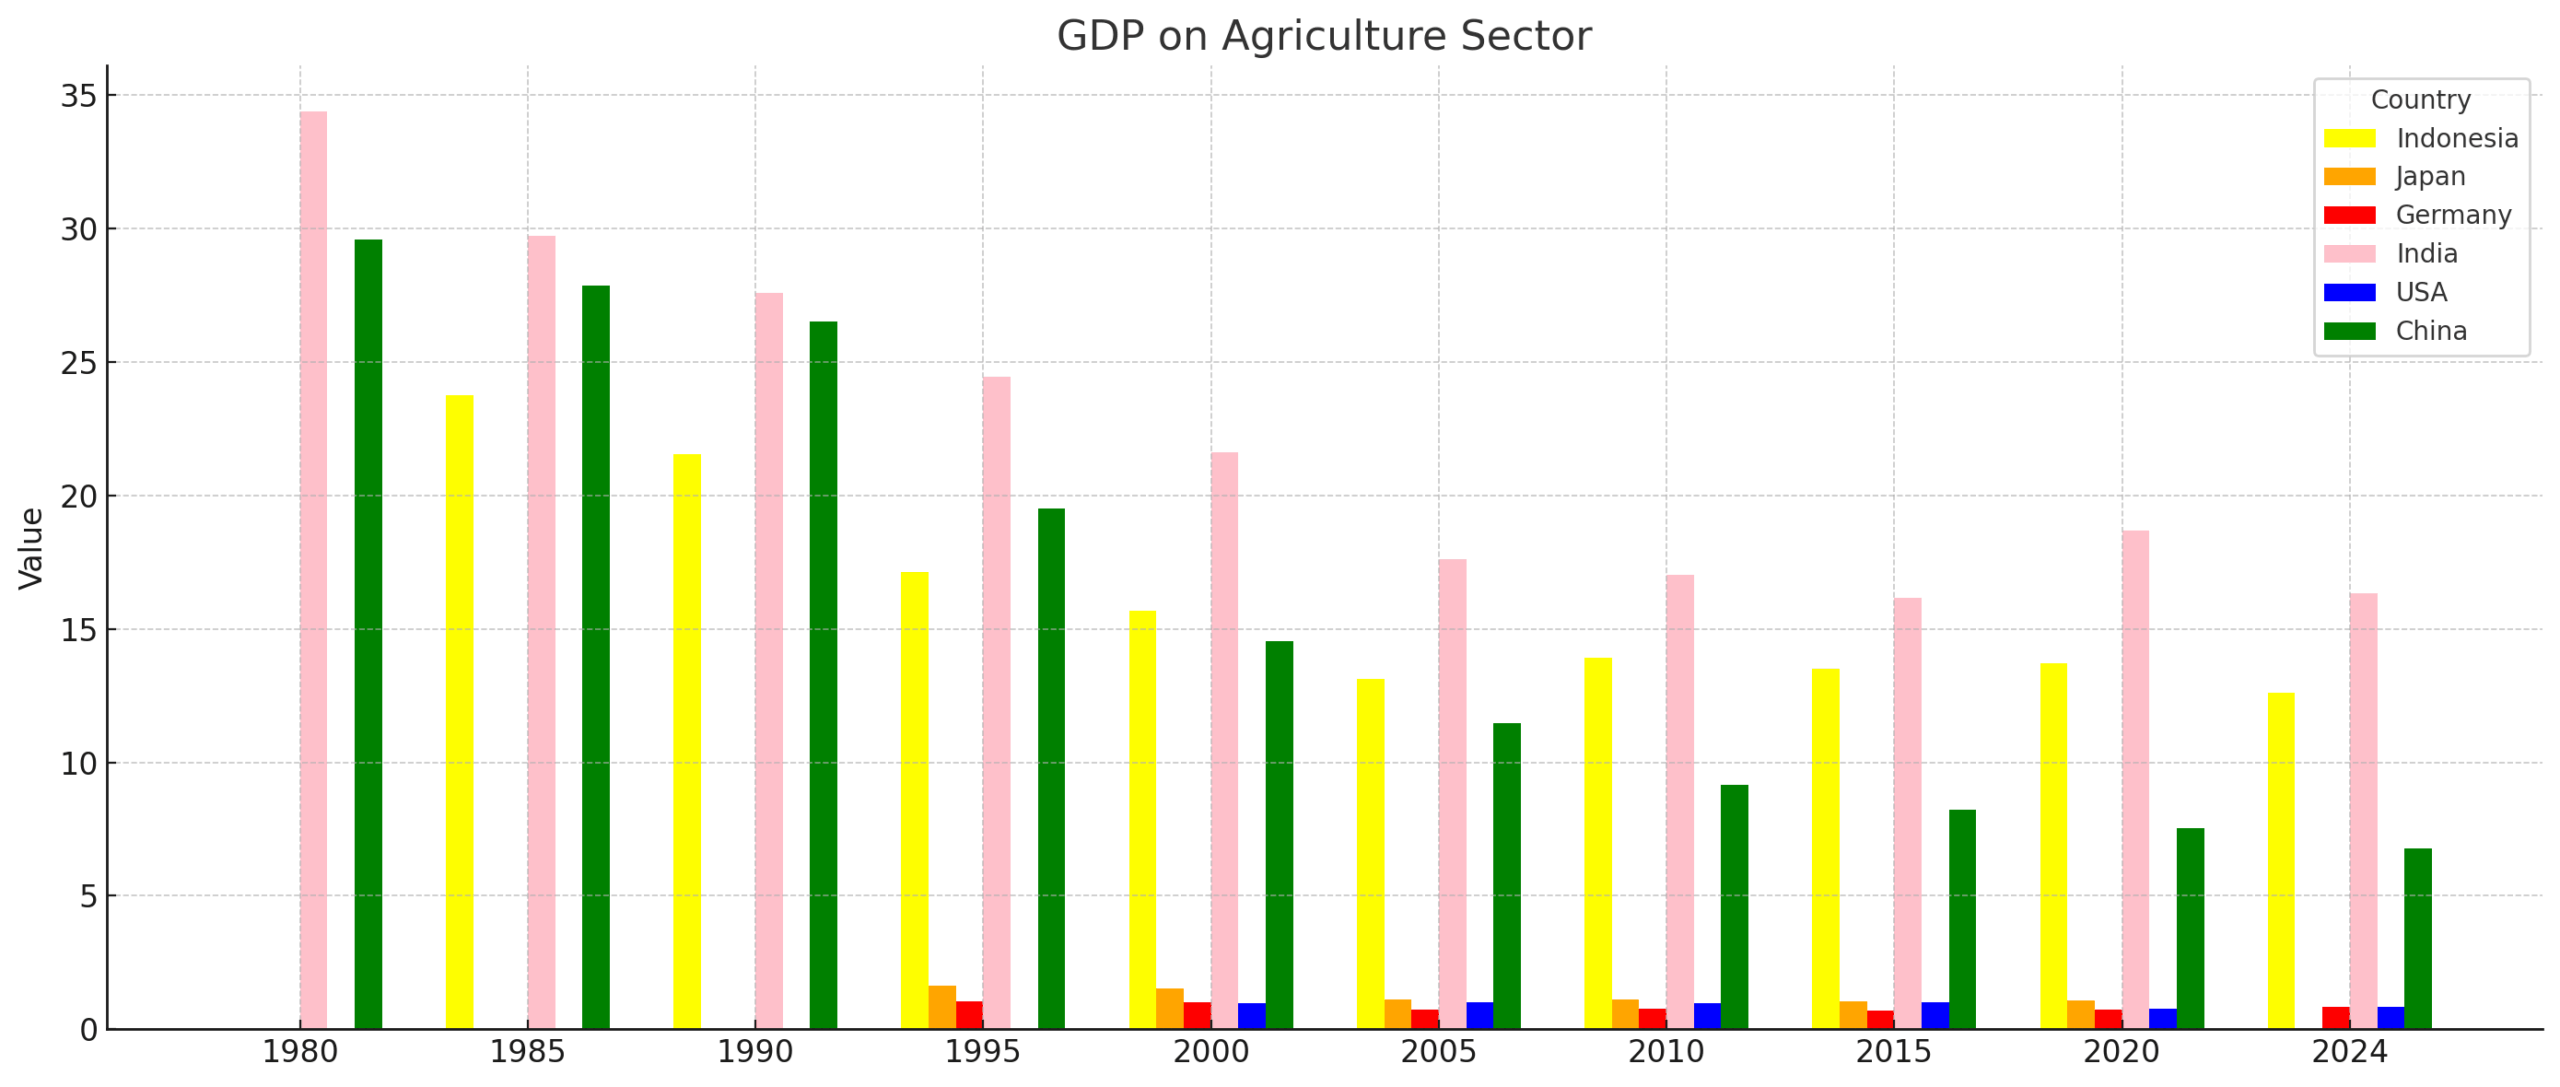
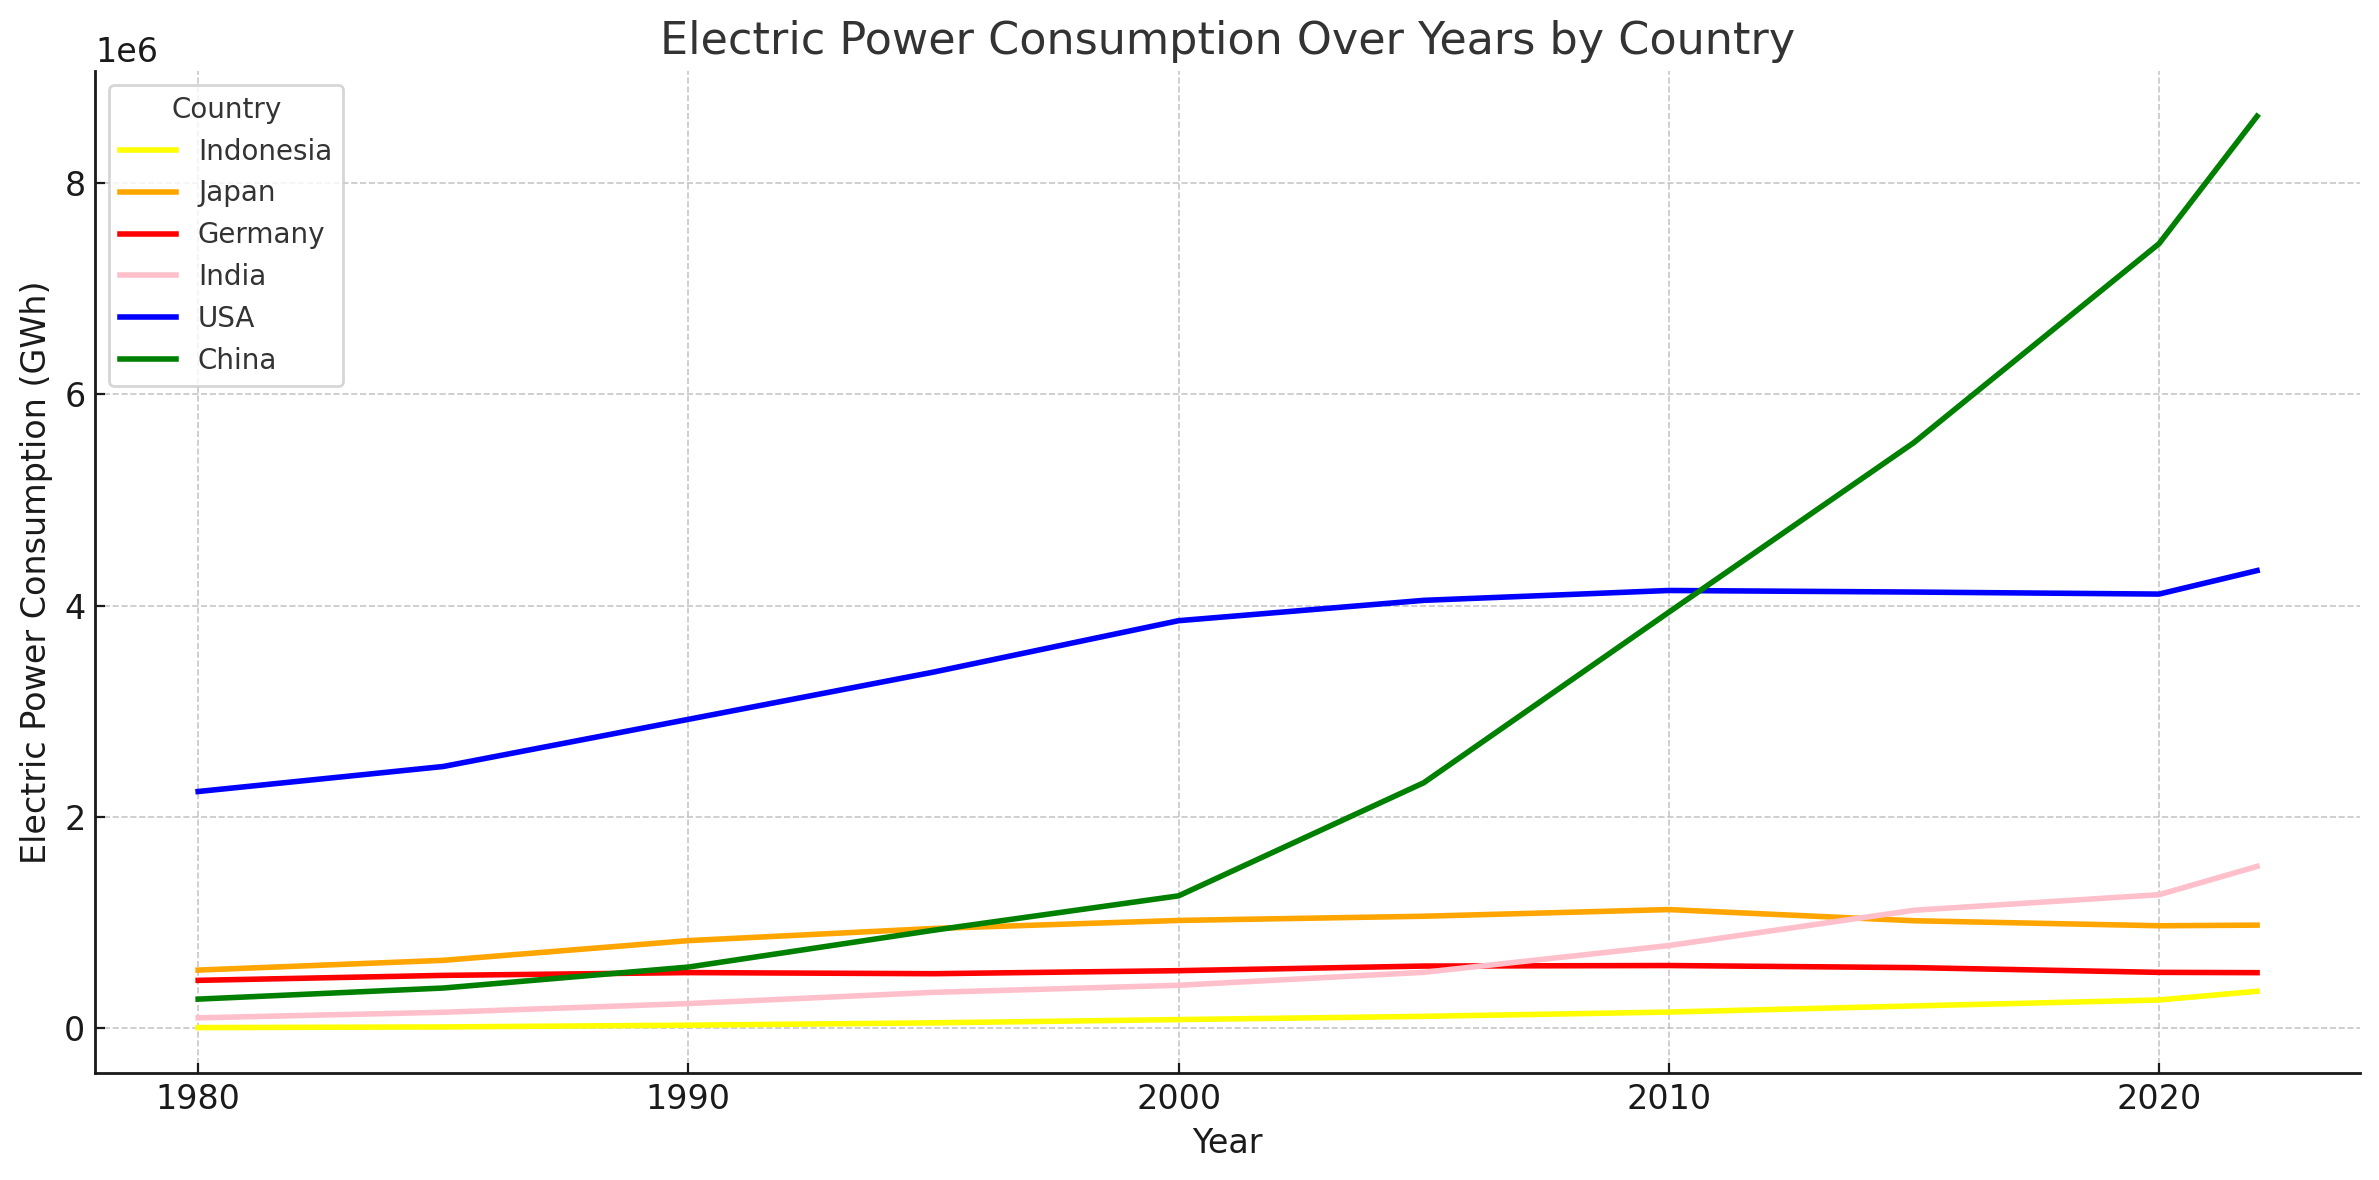
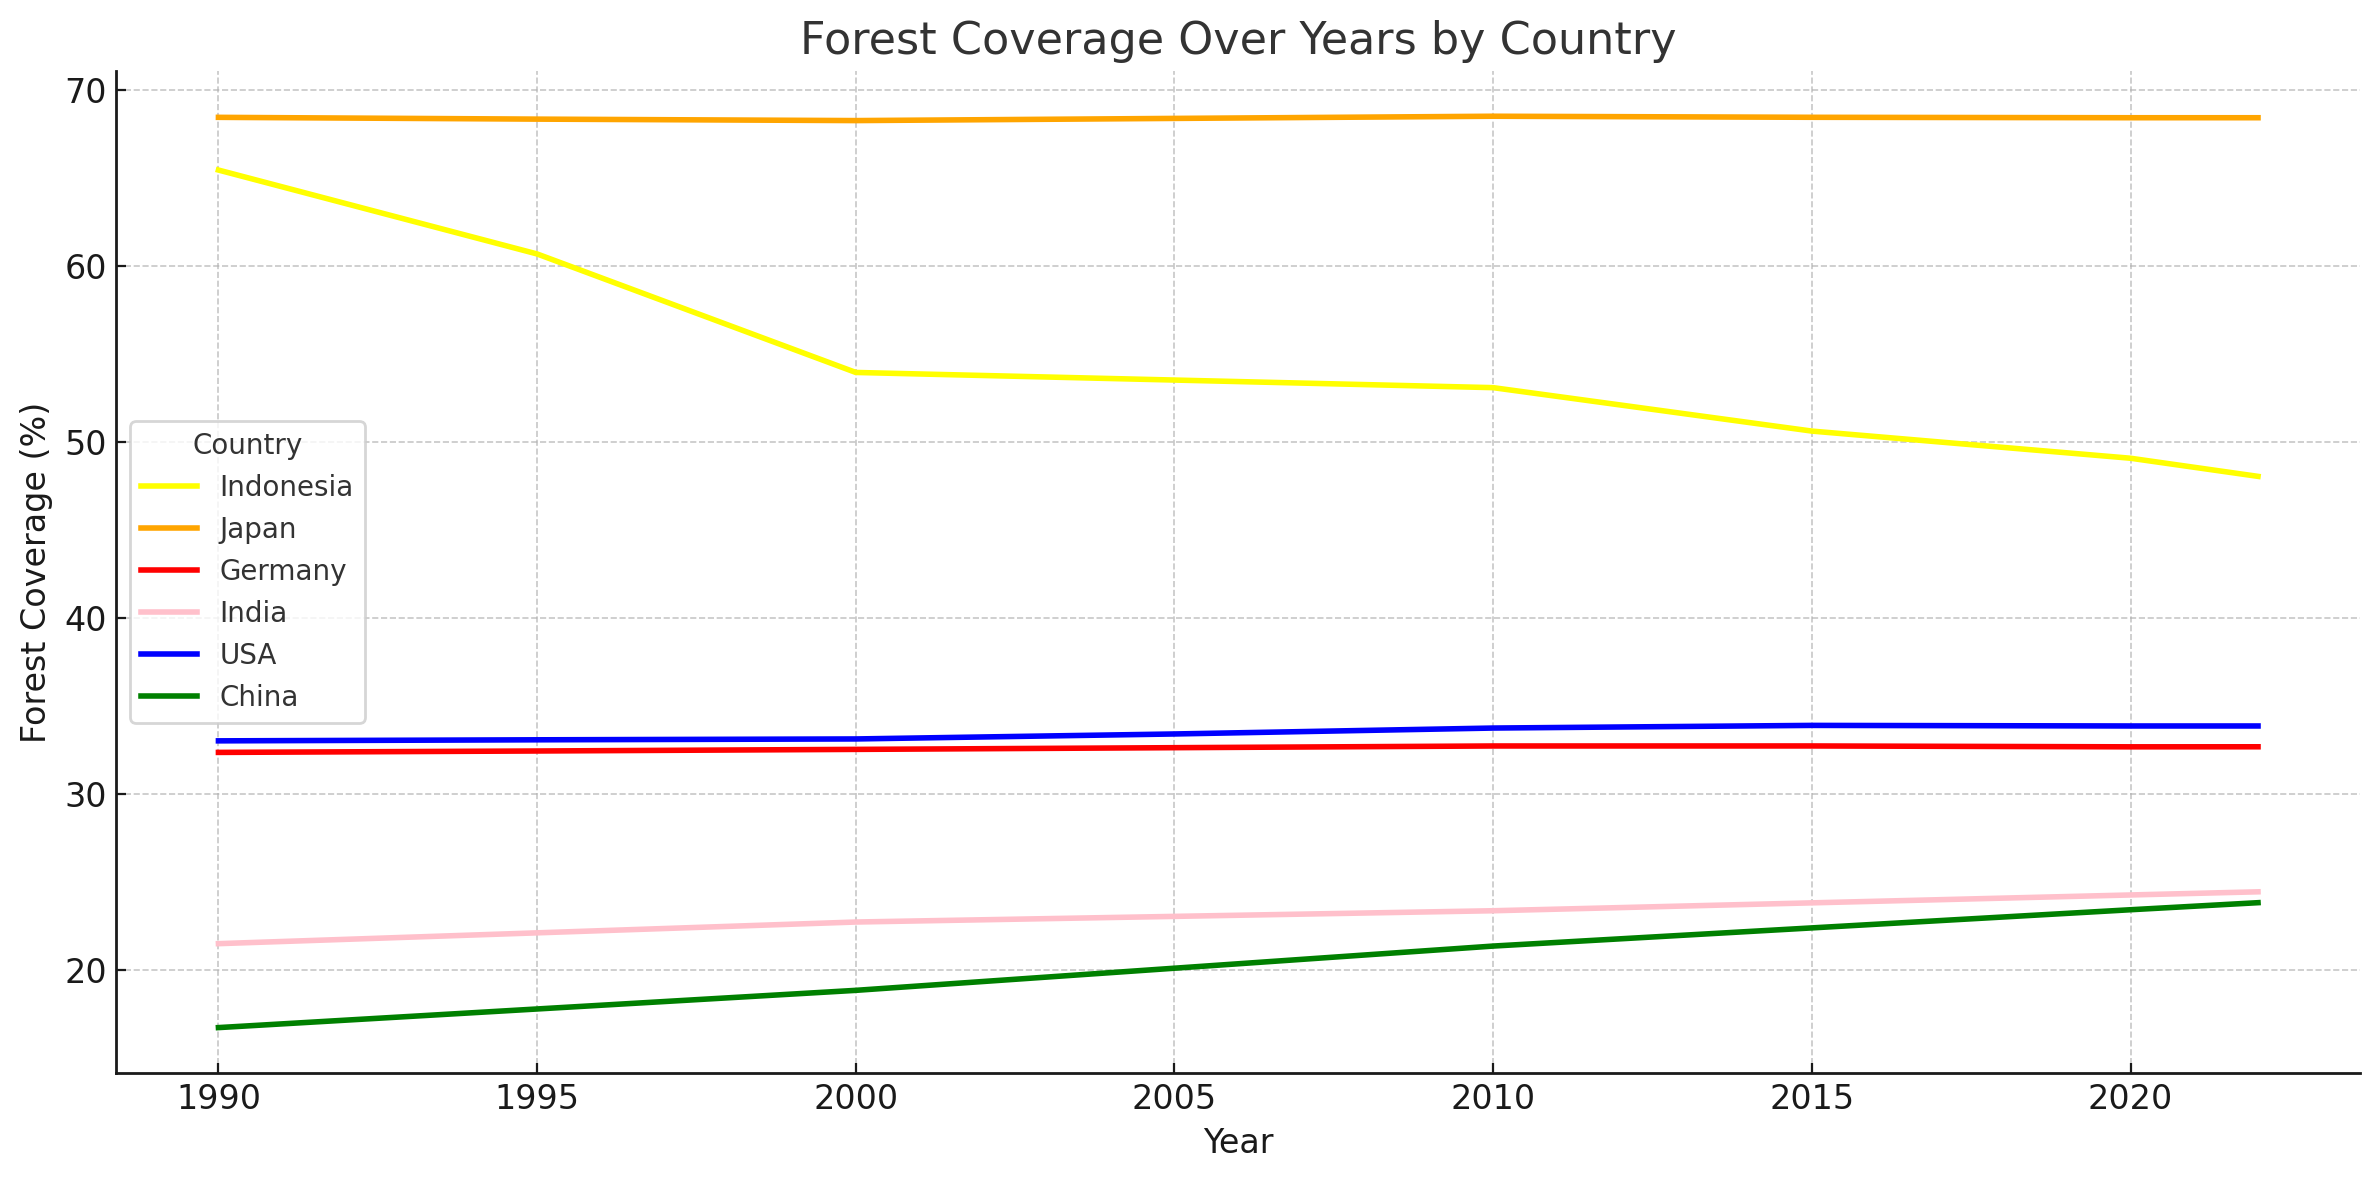
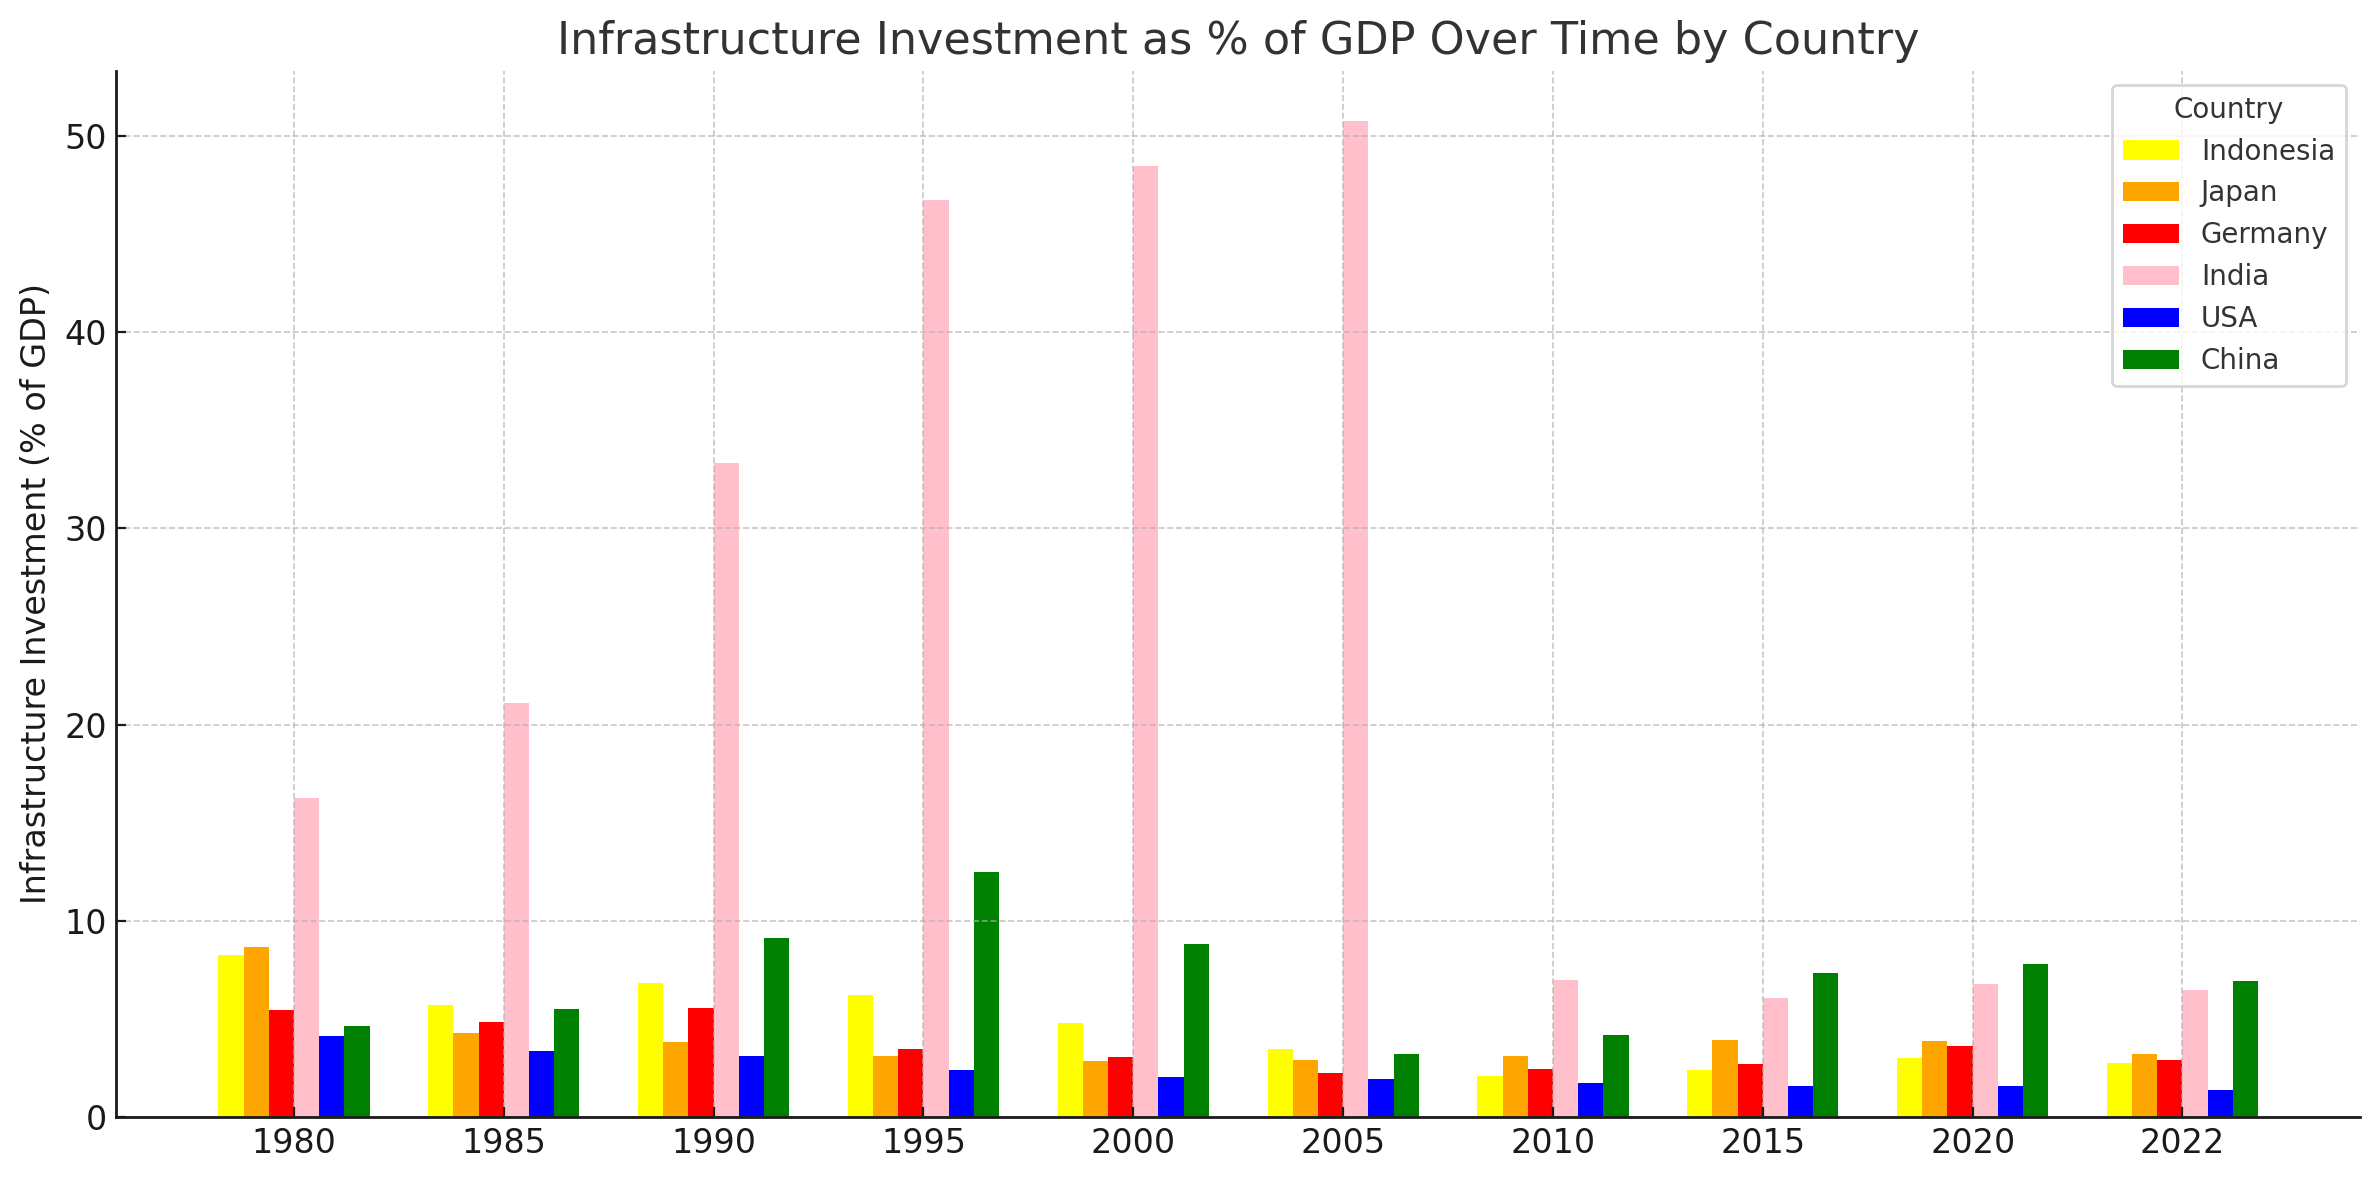
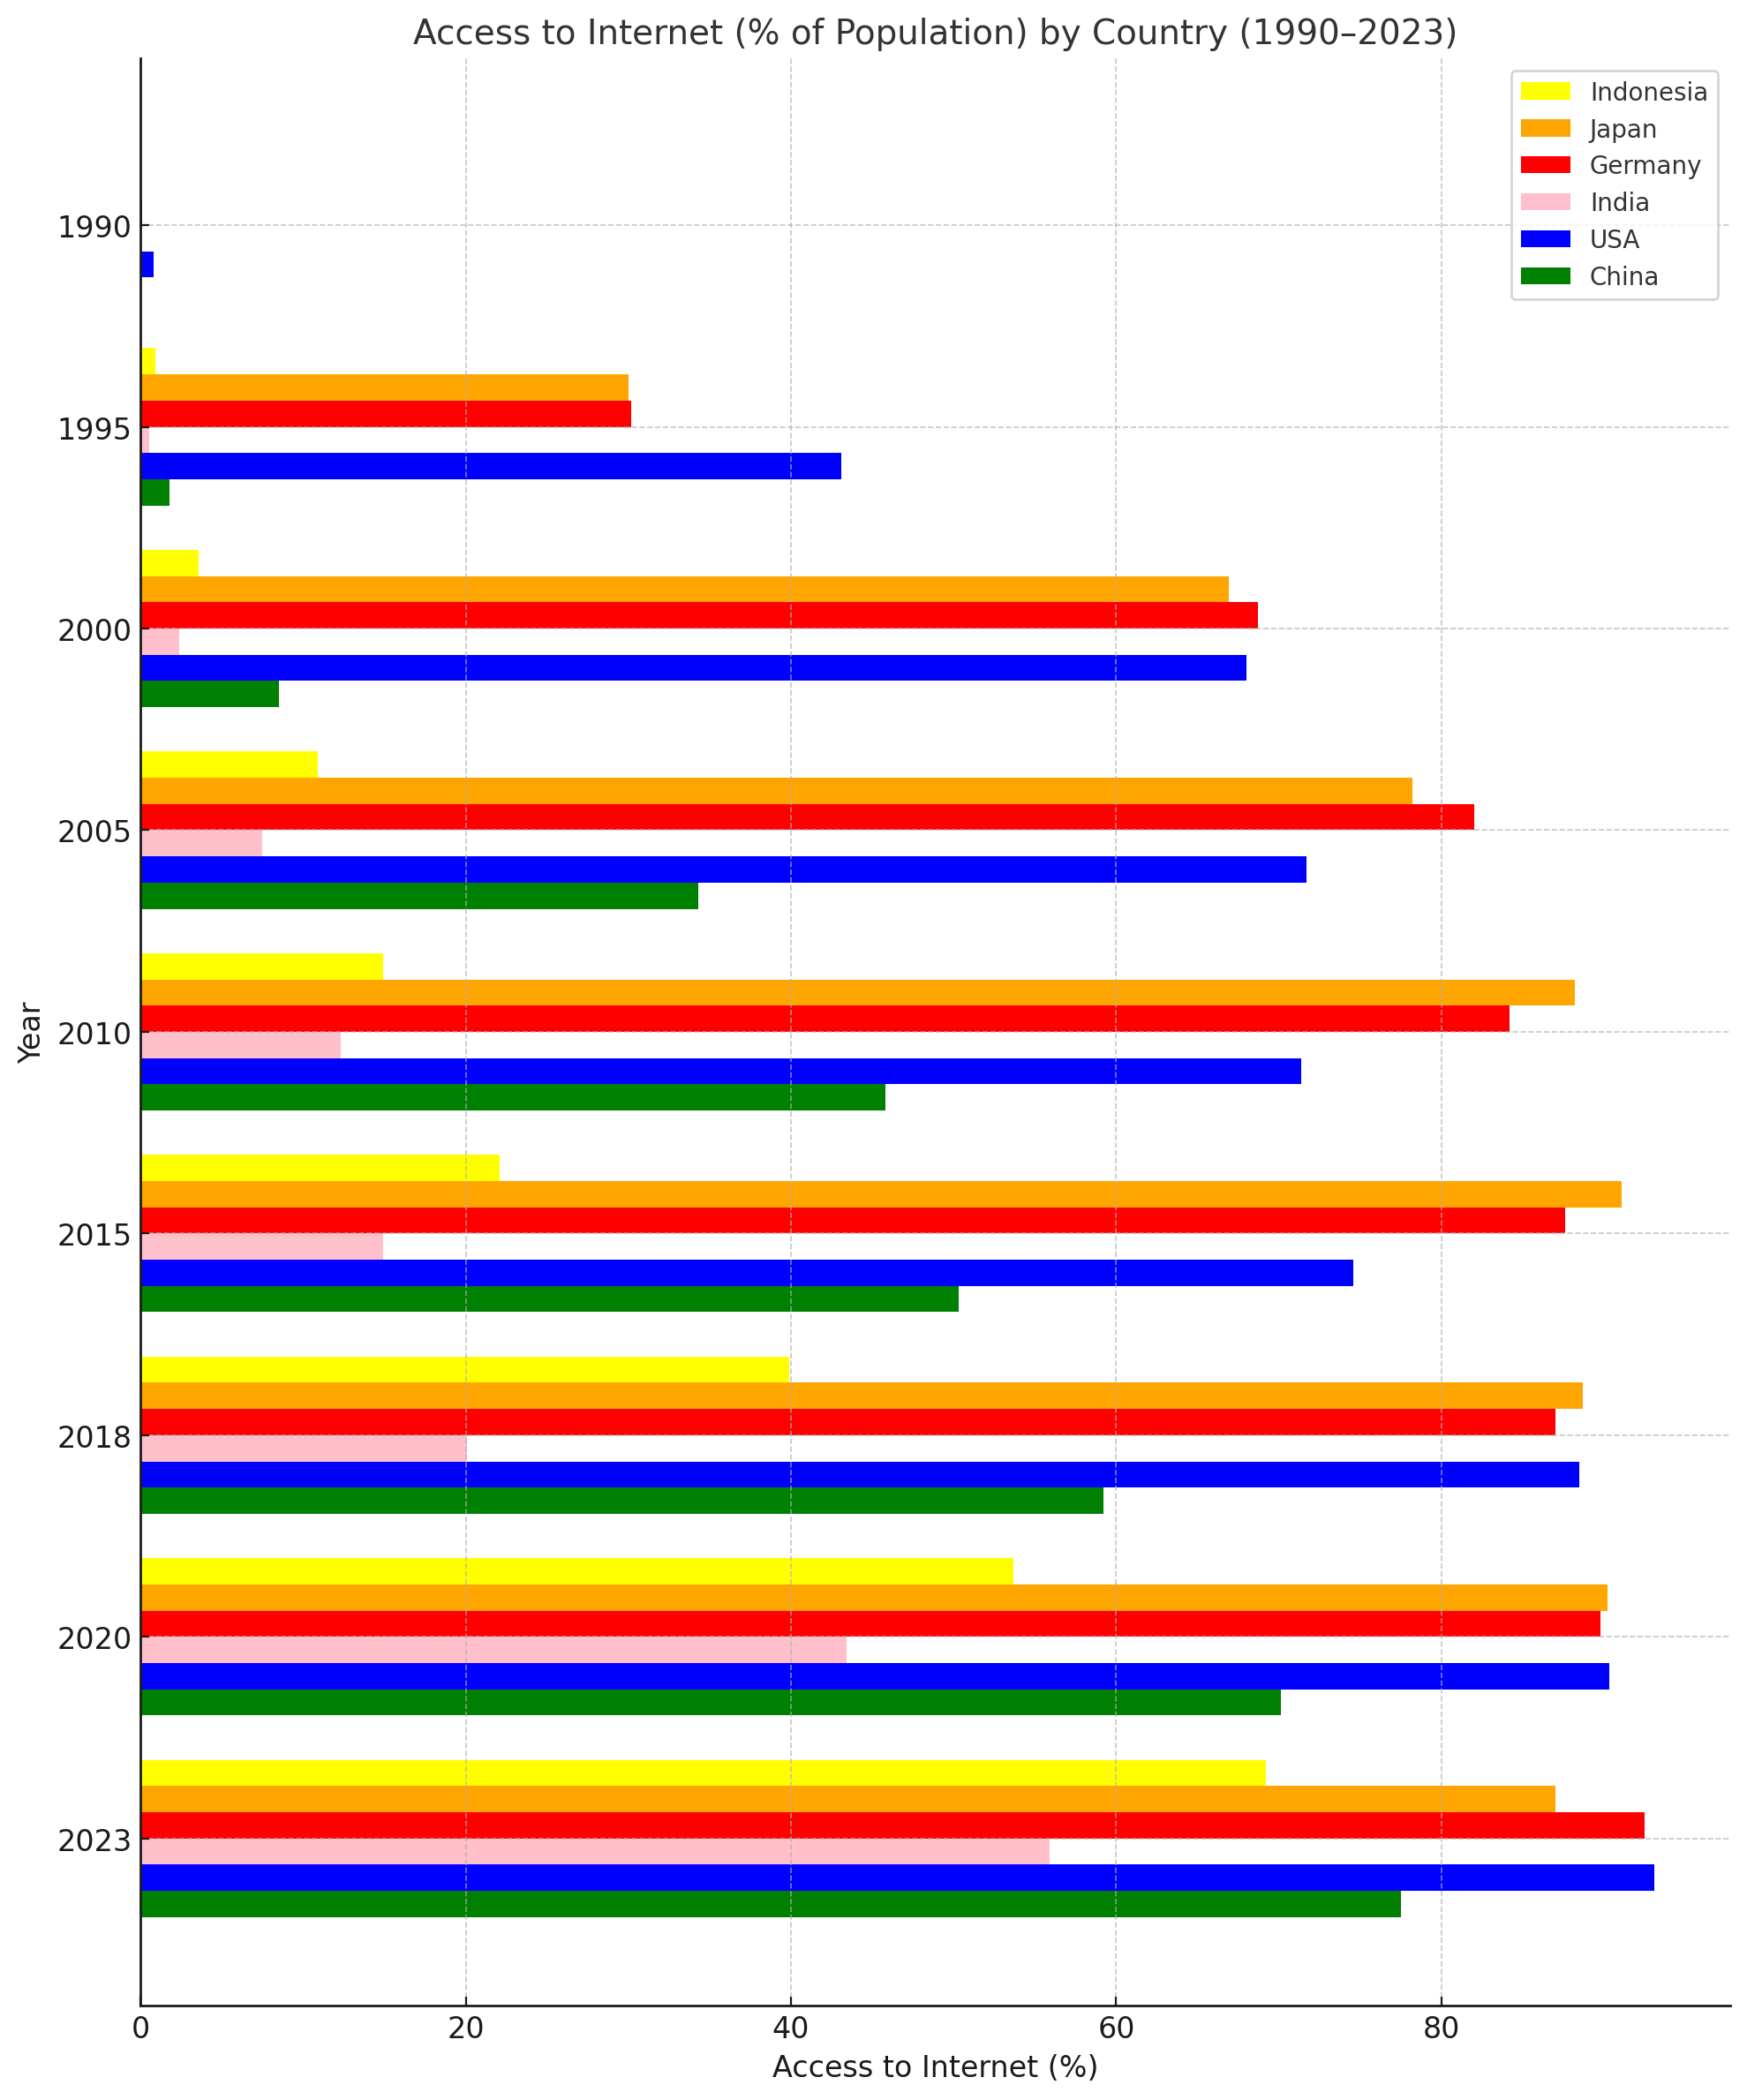
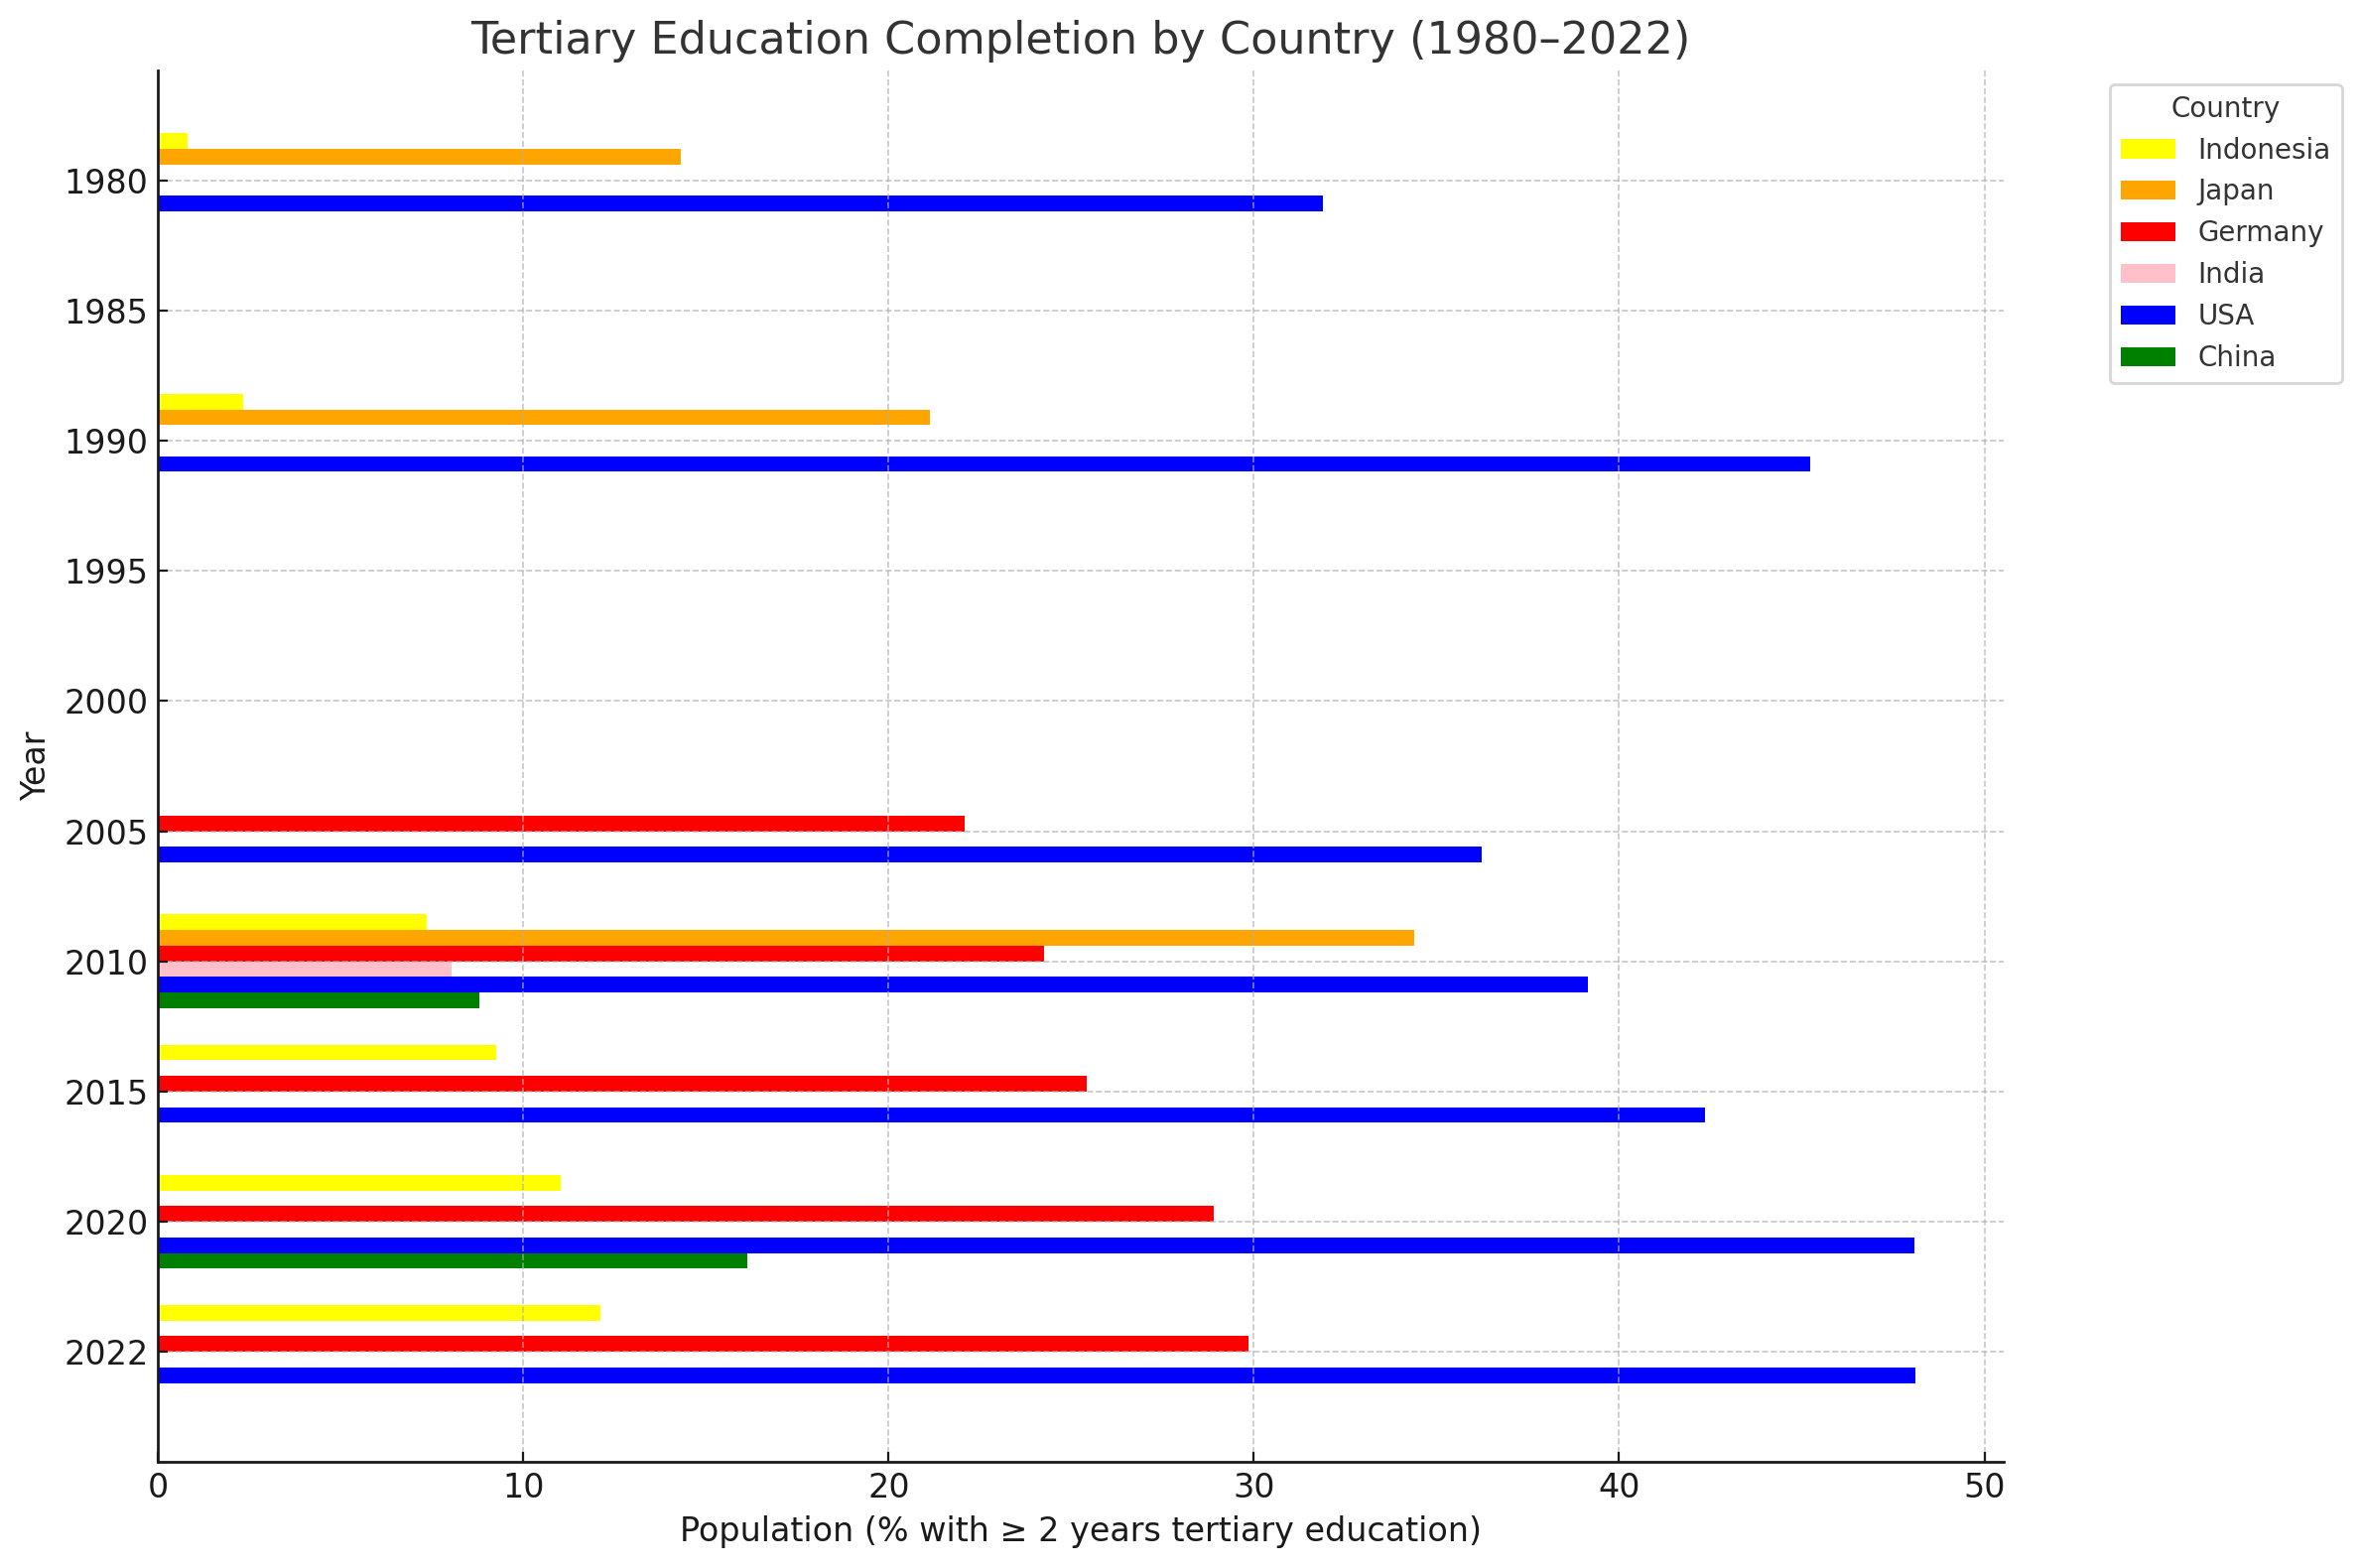
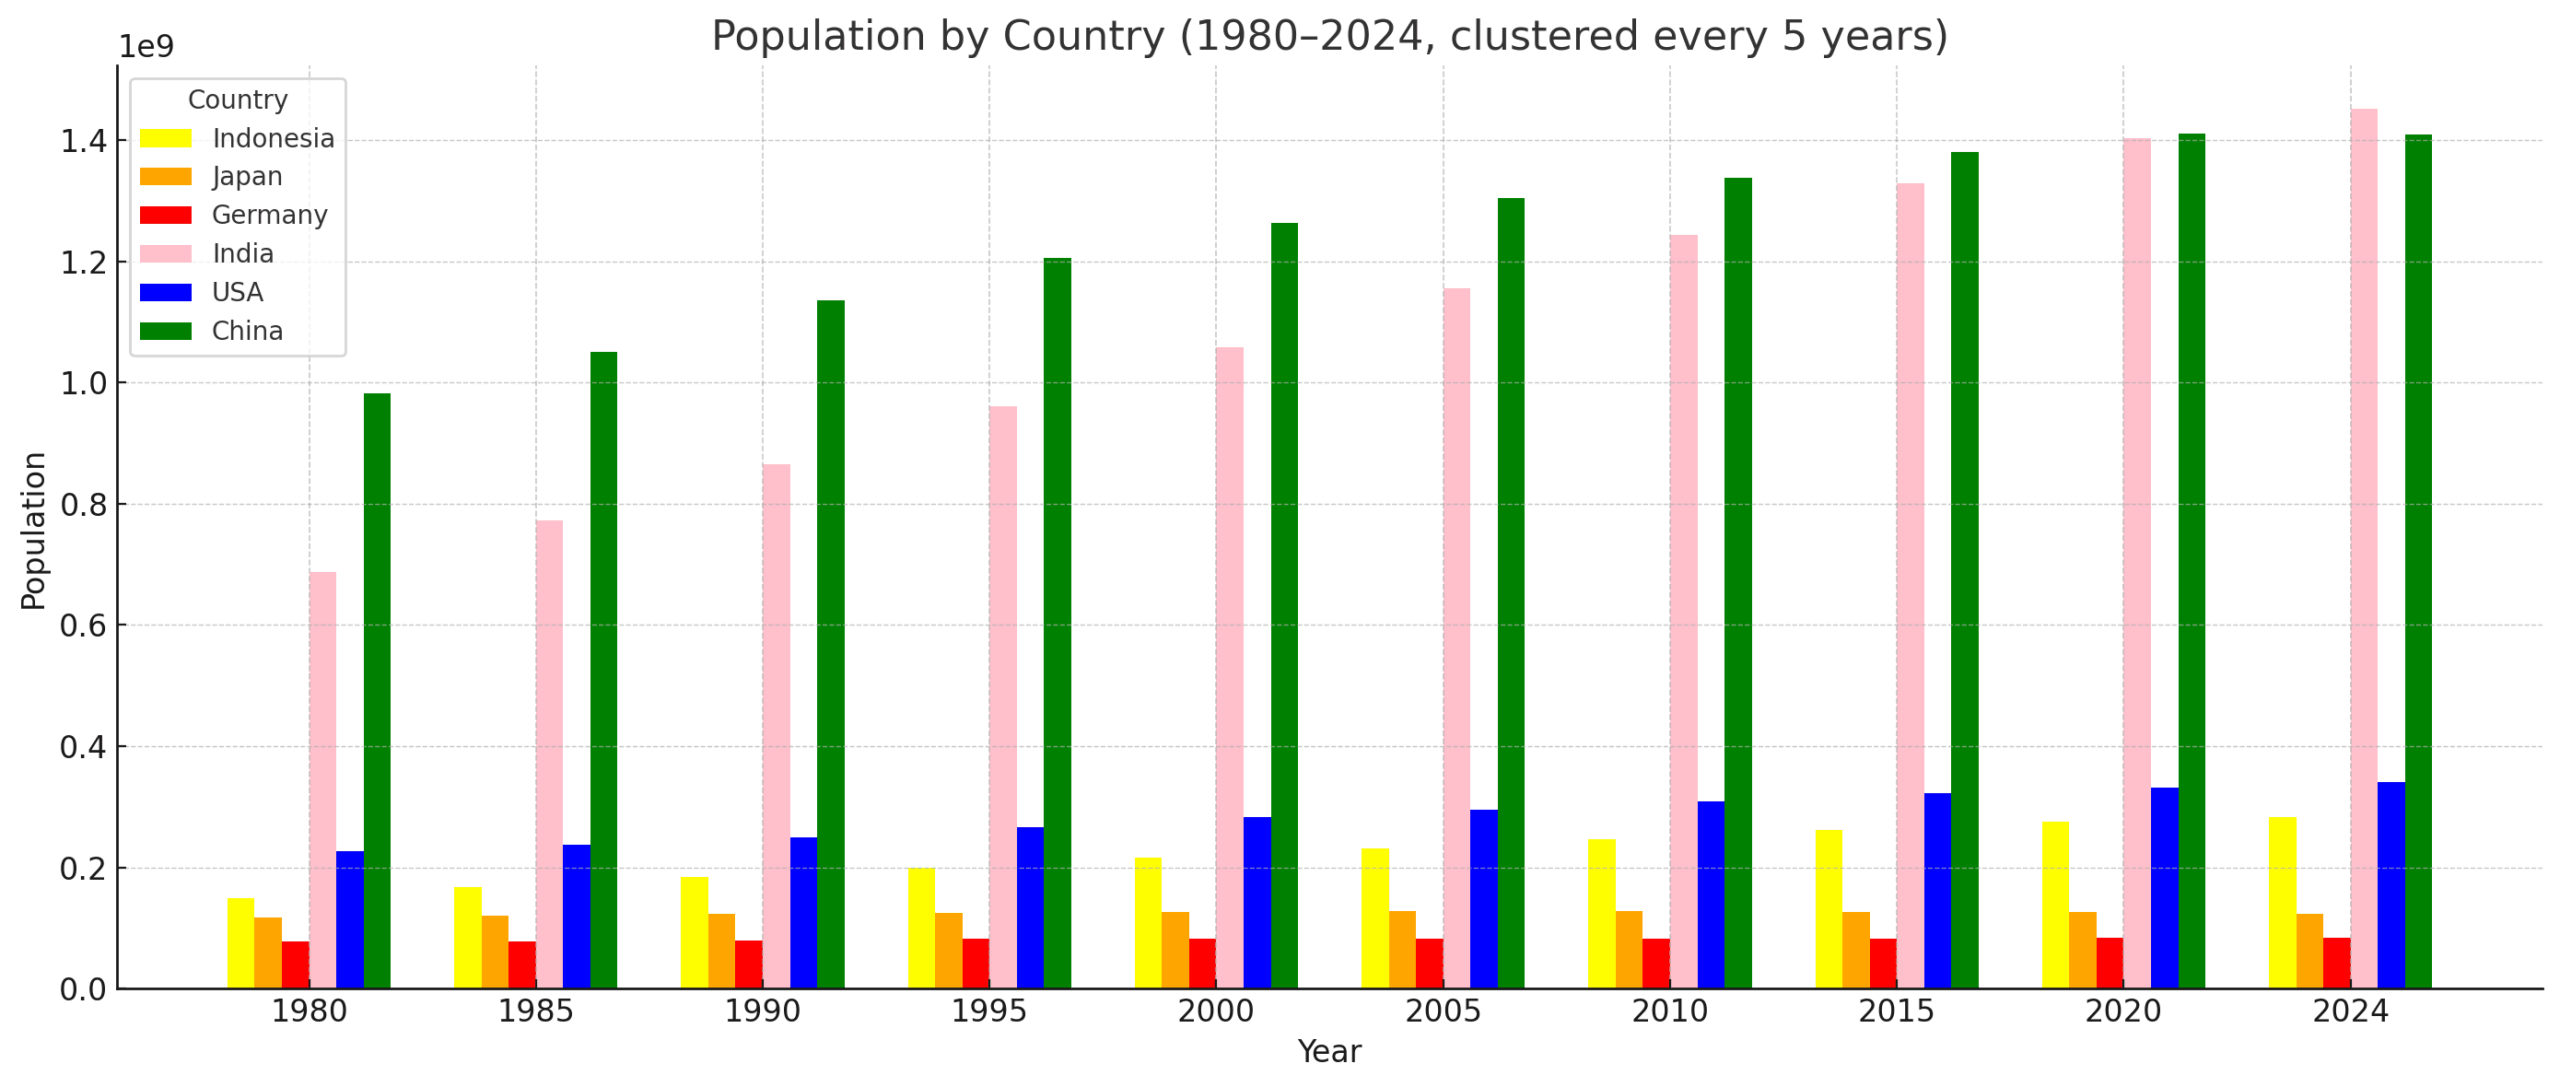
China has the second largest population in the world (see graph 18 for China population. India passed China in population in 2023). Its GDP per capita is a modest 27K per year, about the same level of Poland and Portugal (see graph-8 for GDP per capita). If we look further into the economic statistics, China becomes more and more industrialized and the share of GDP in agriculture is dropping (lower than 7% in 2024, see graph-1). The country keeps a significant investment in infrastructure (about 7% of GDP in 2022, see graph-12). The internet coverage (4G and 5G) can reach every city and village in the rural area (see graph-14 for the percentage of population using the internet). It also has a sufficiently educated and skilled workforce (about 227 millions with minimum 2 years college education or above in 2020, see graph-16). The country also has invested a lot on electricity (see graph-6 for electricity consumption). It would have plenty of electricity to power the AI data center in the coming AI era
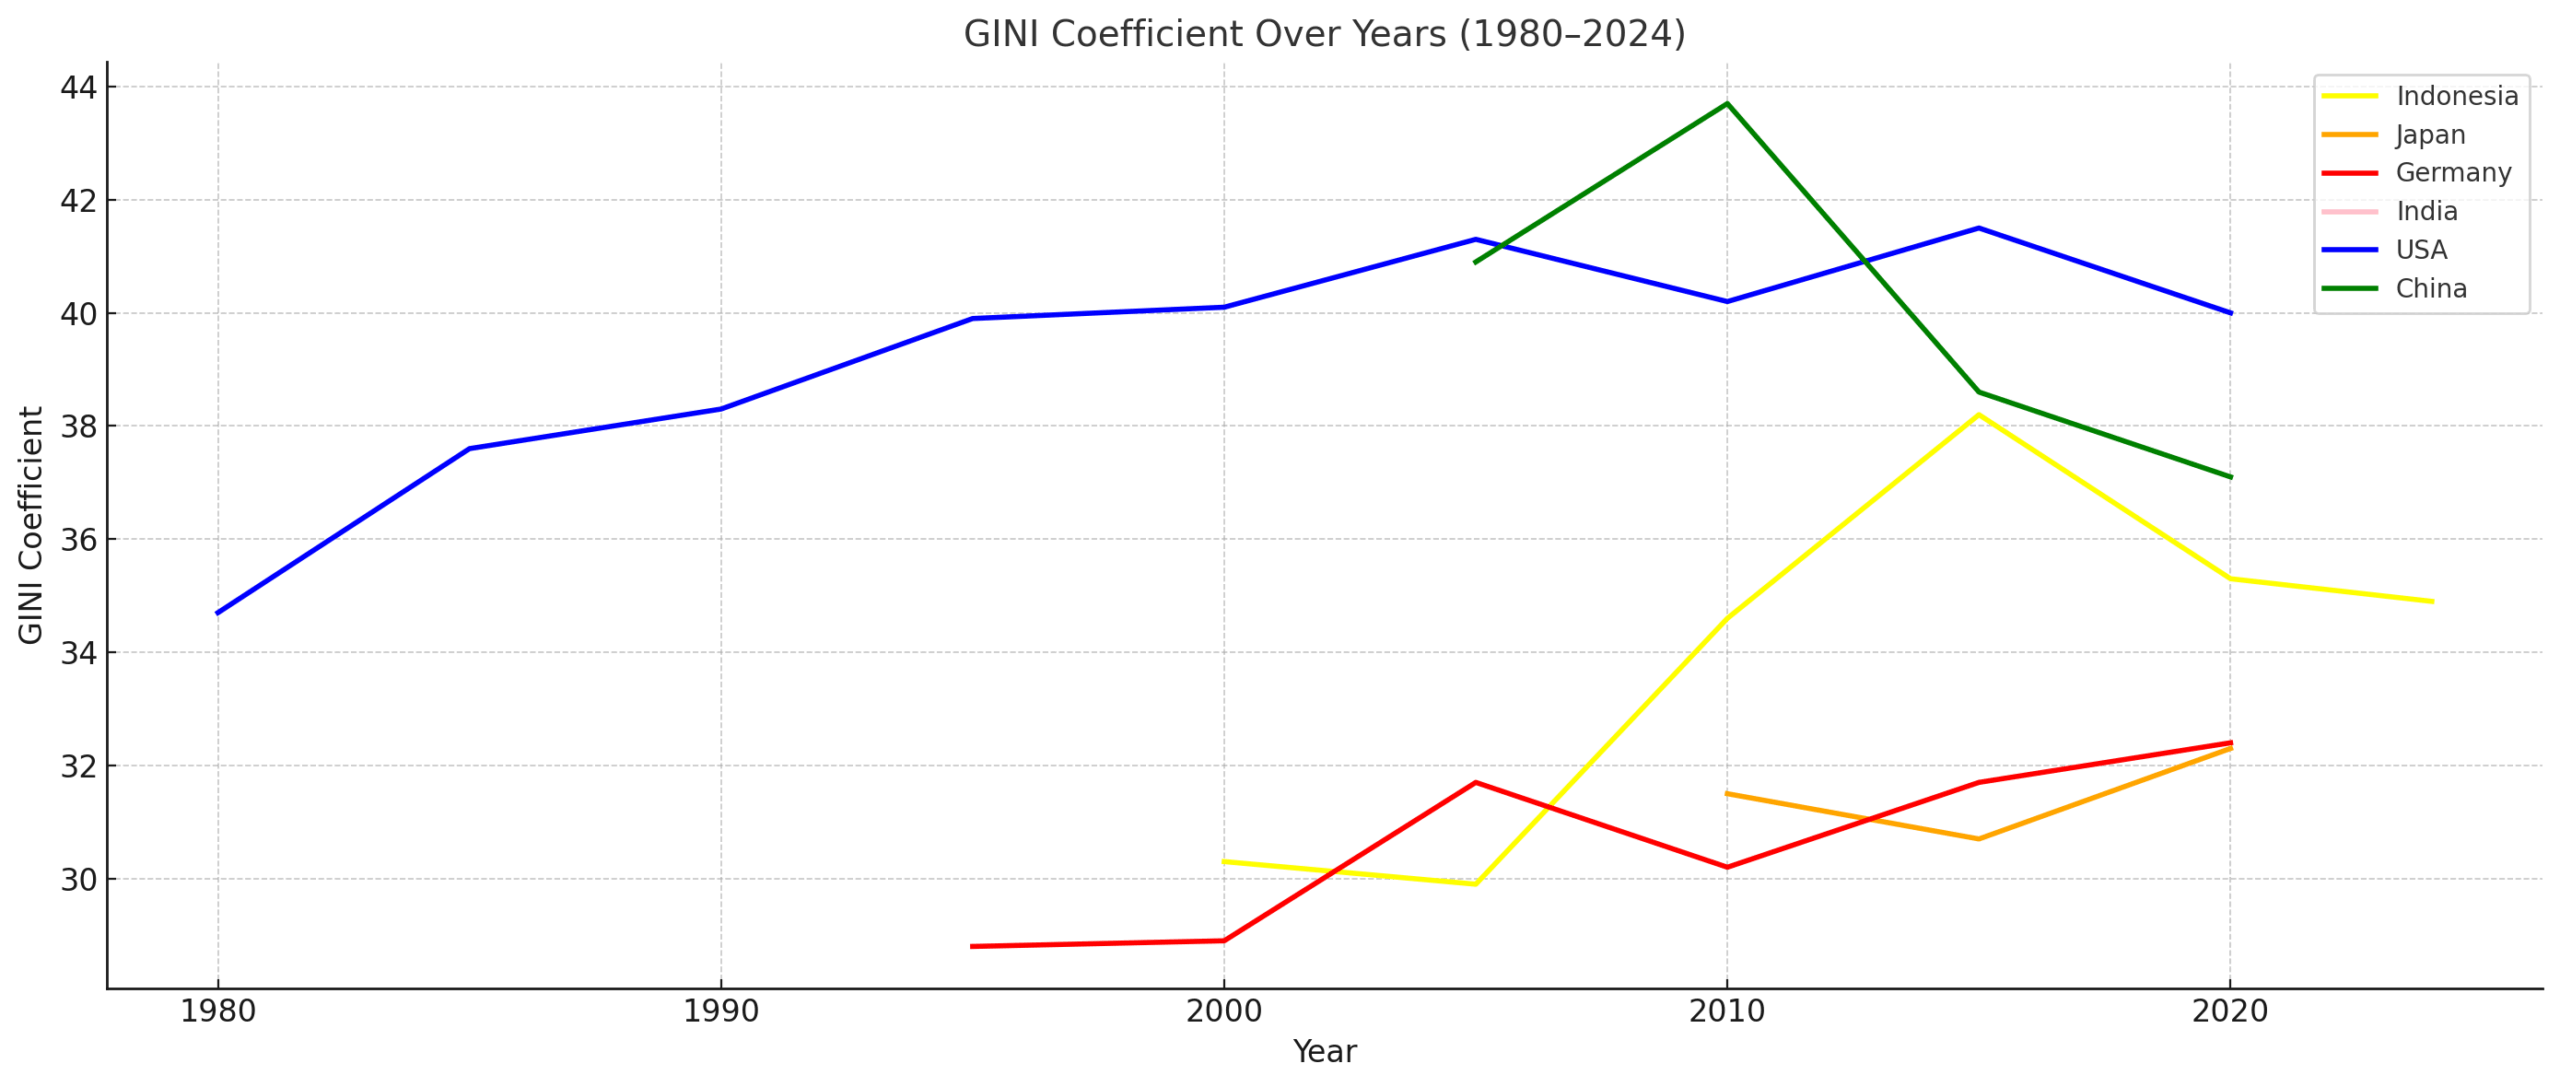
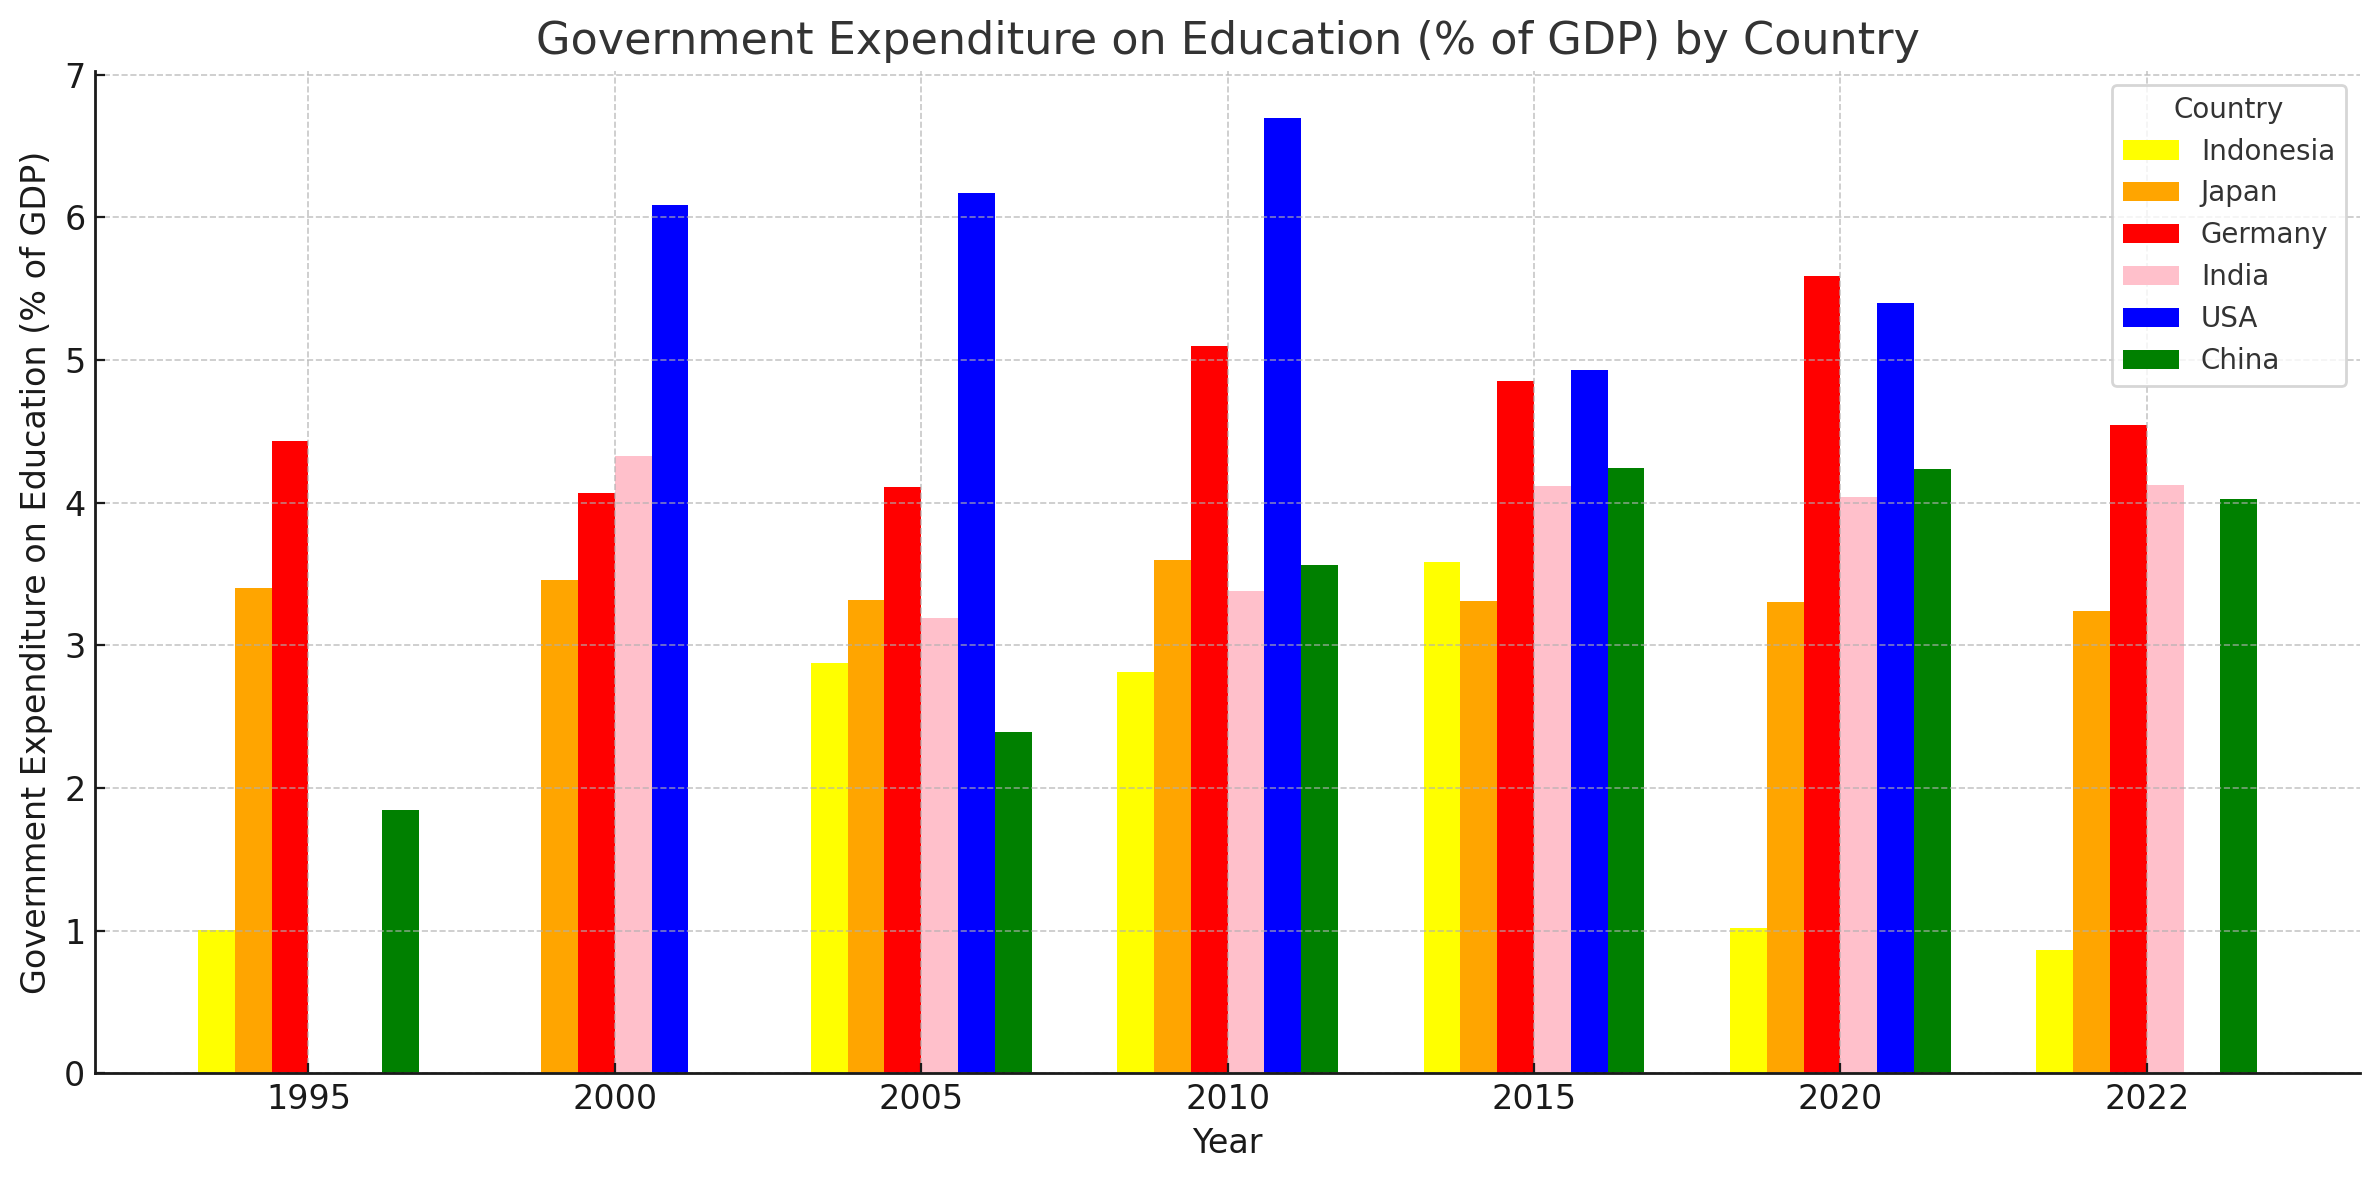
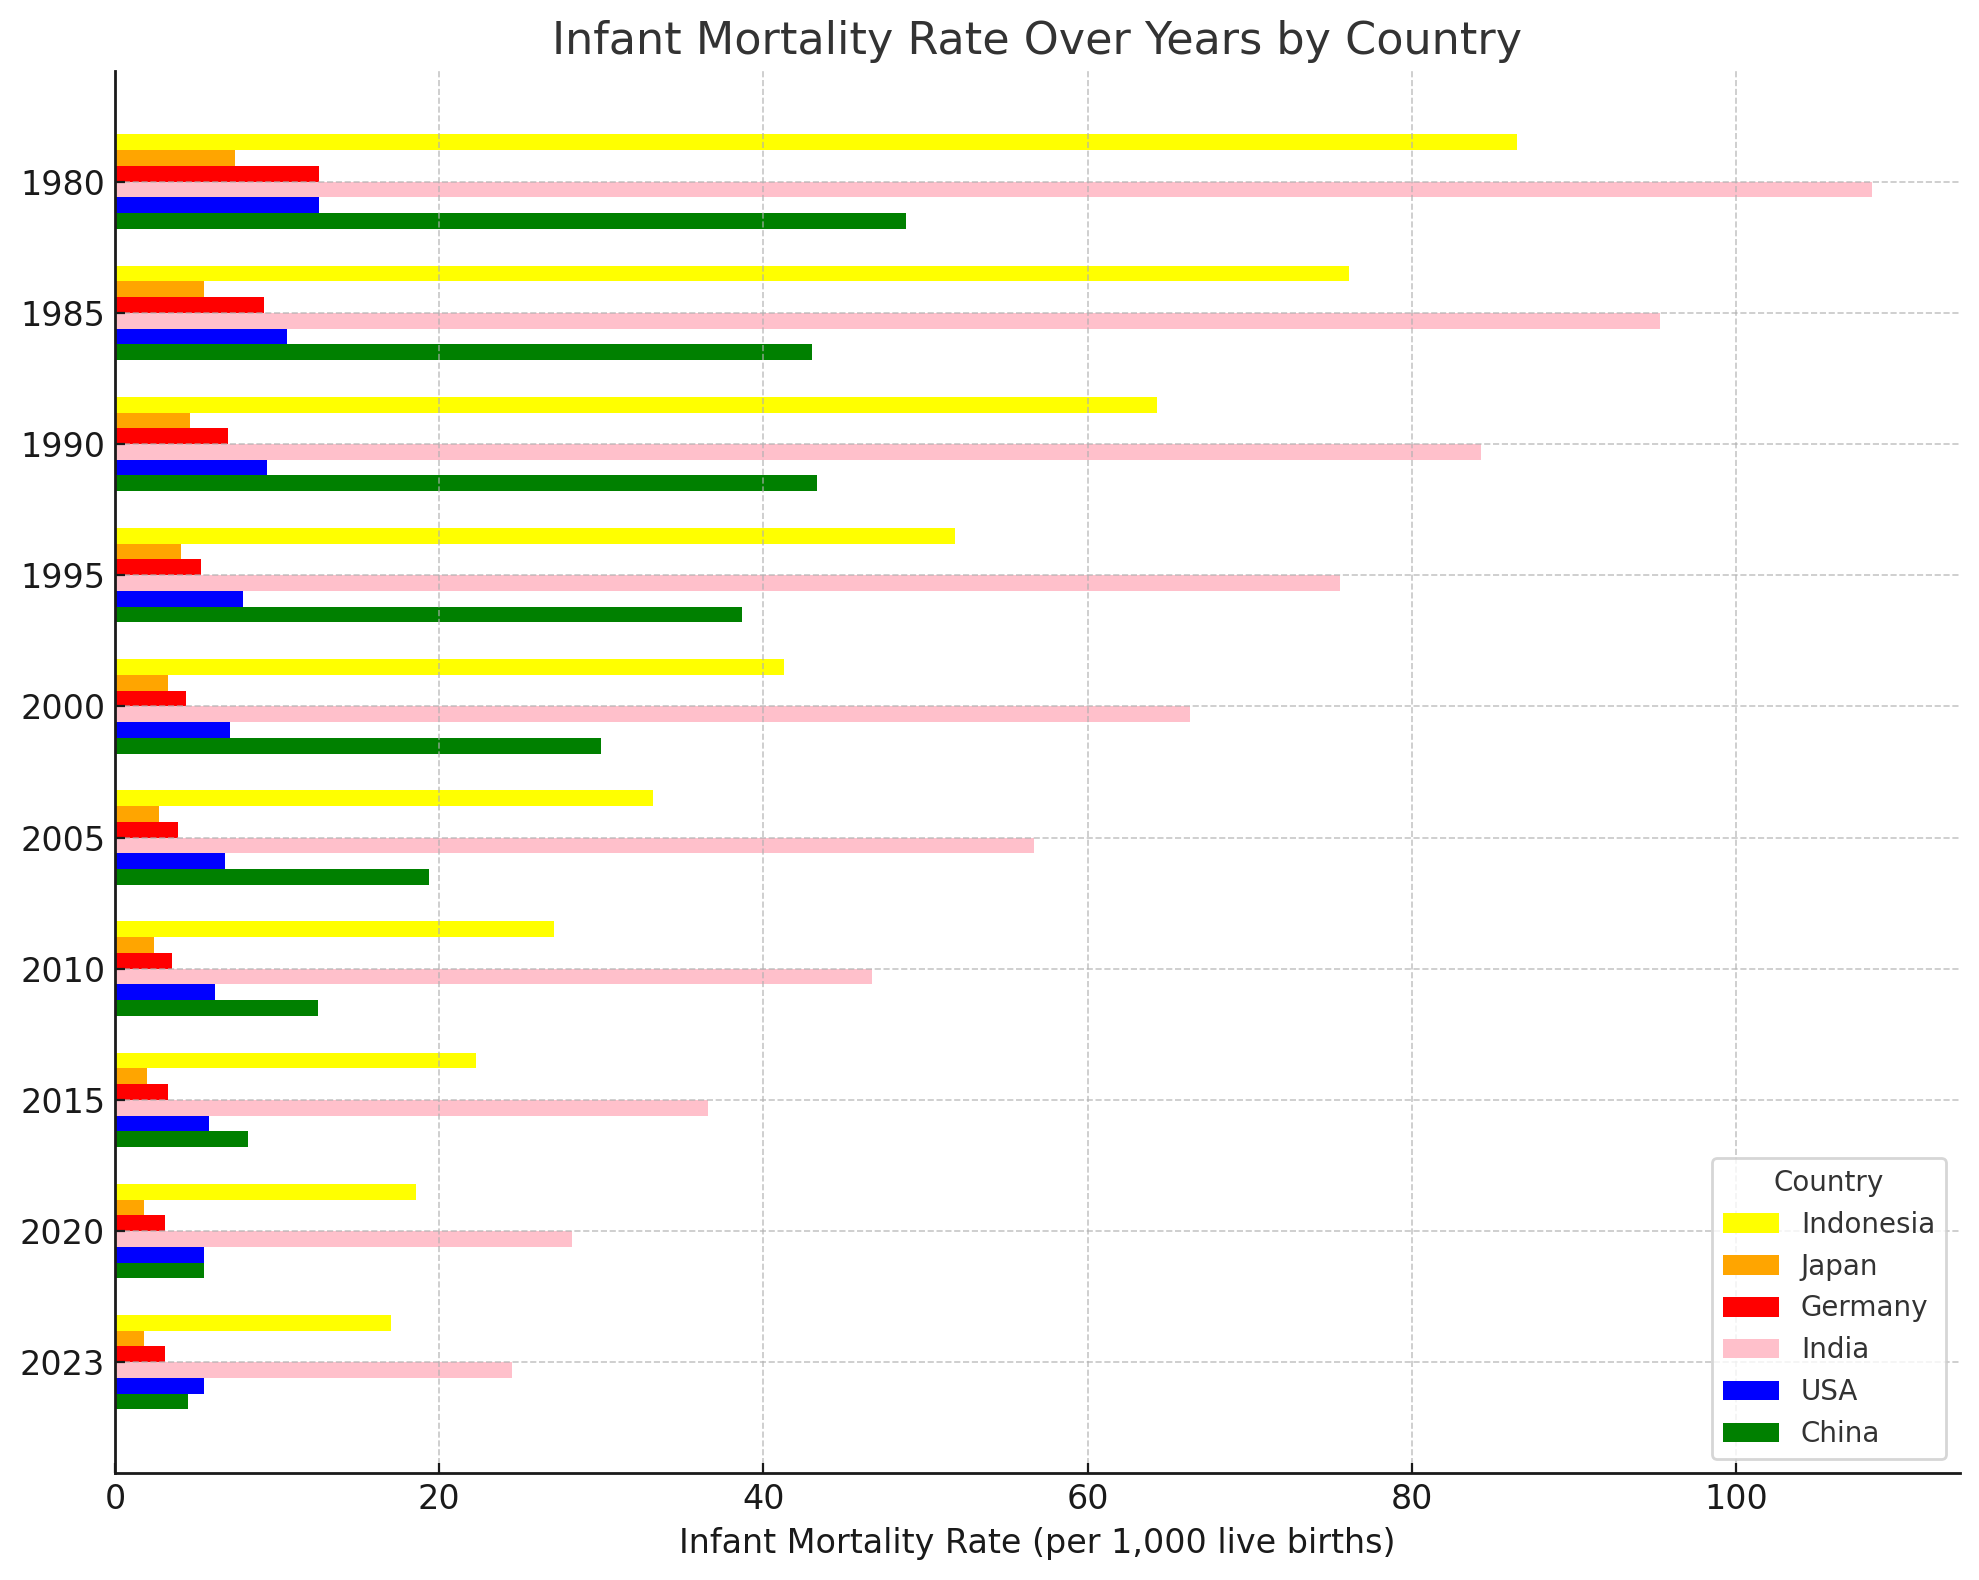
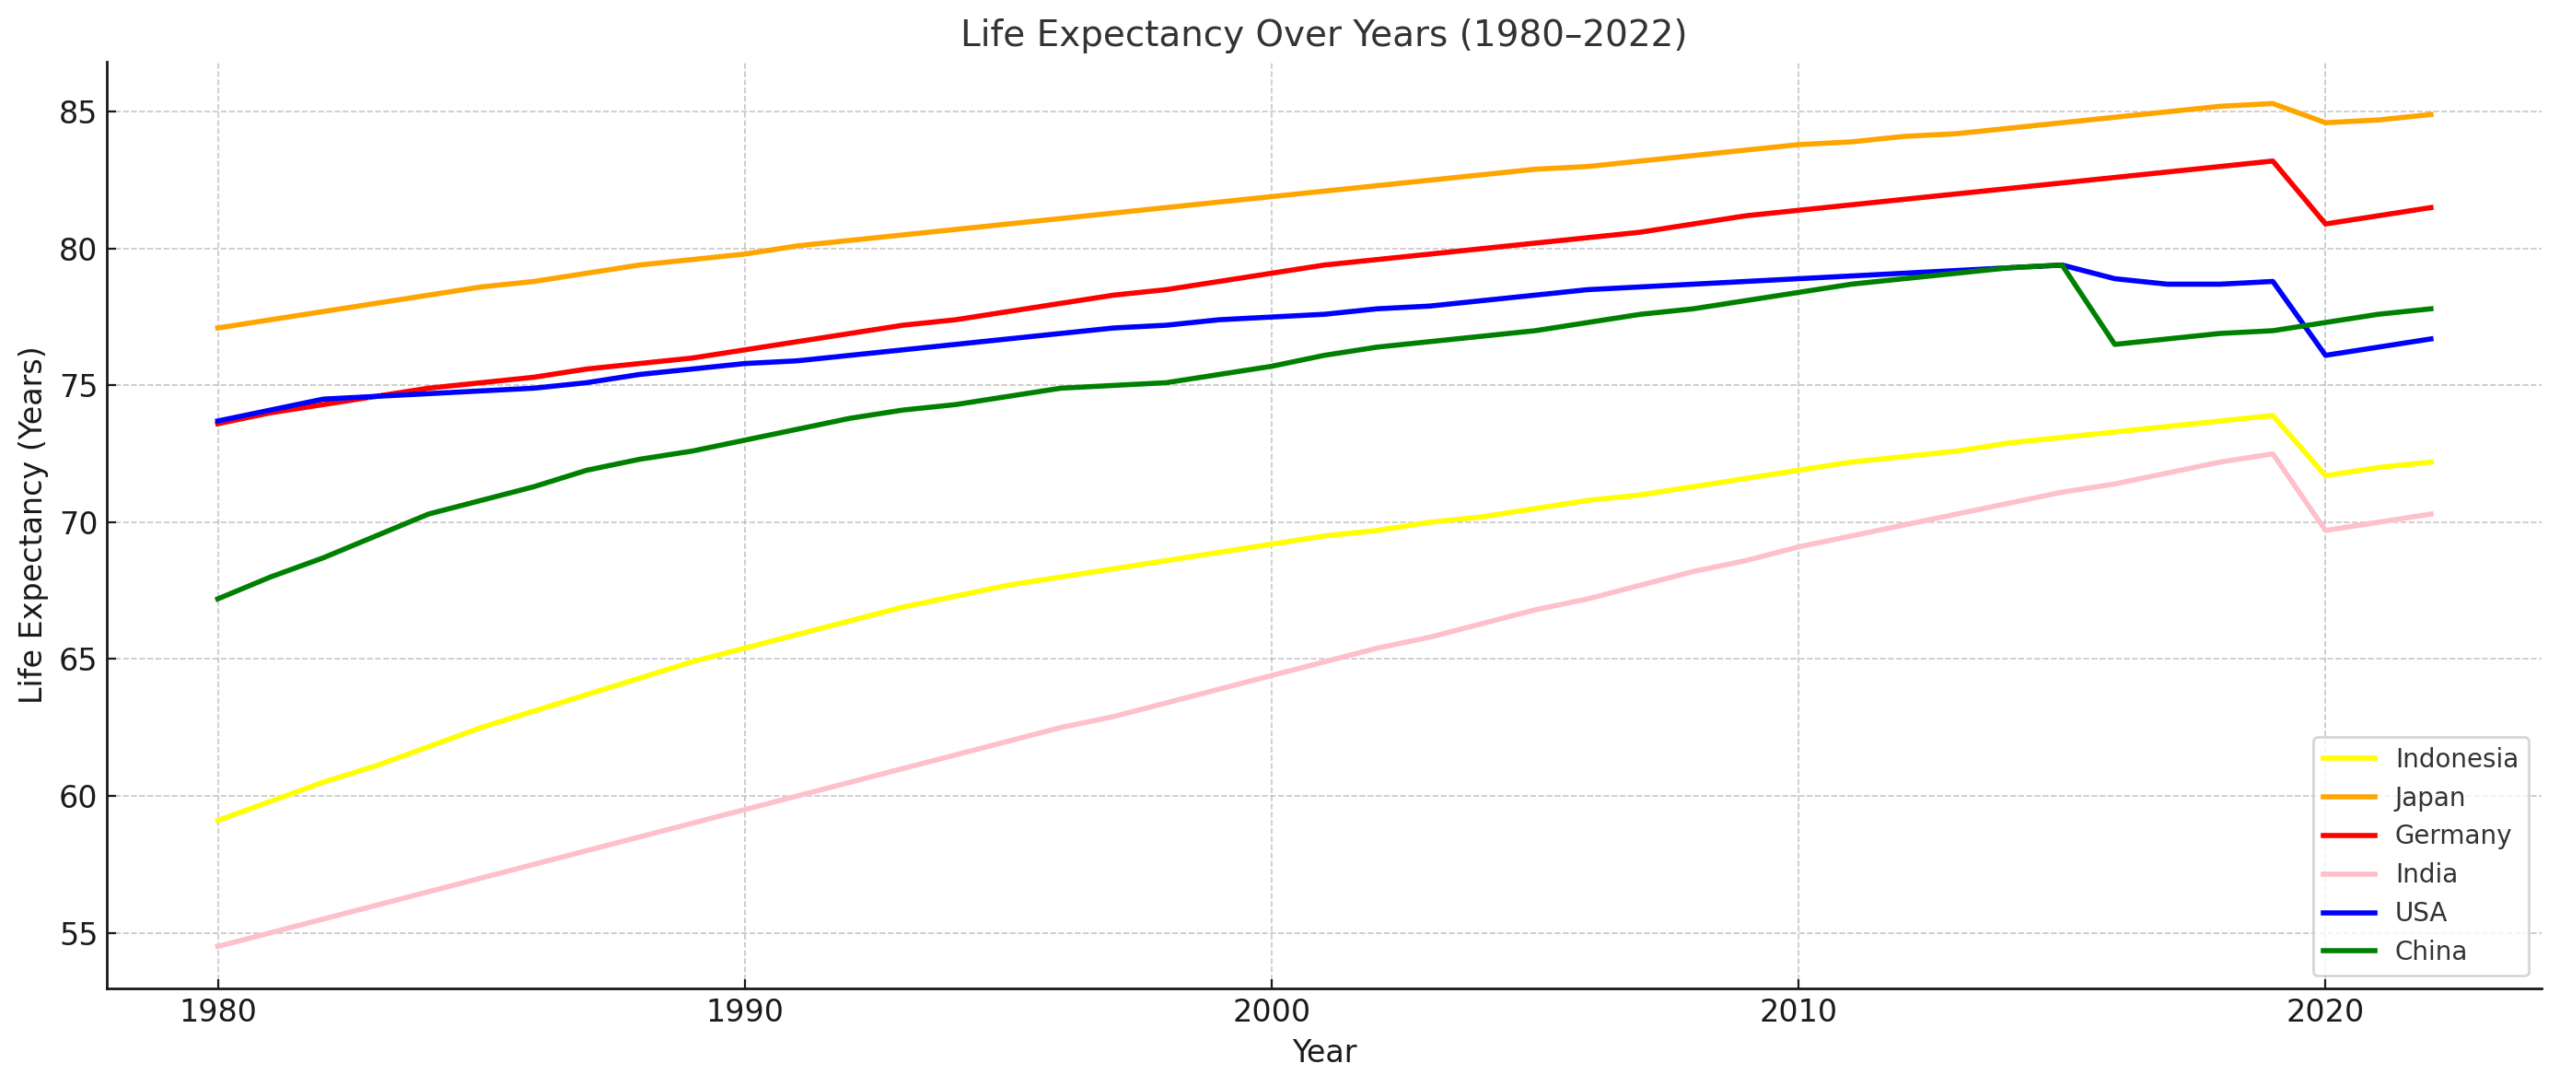
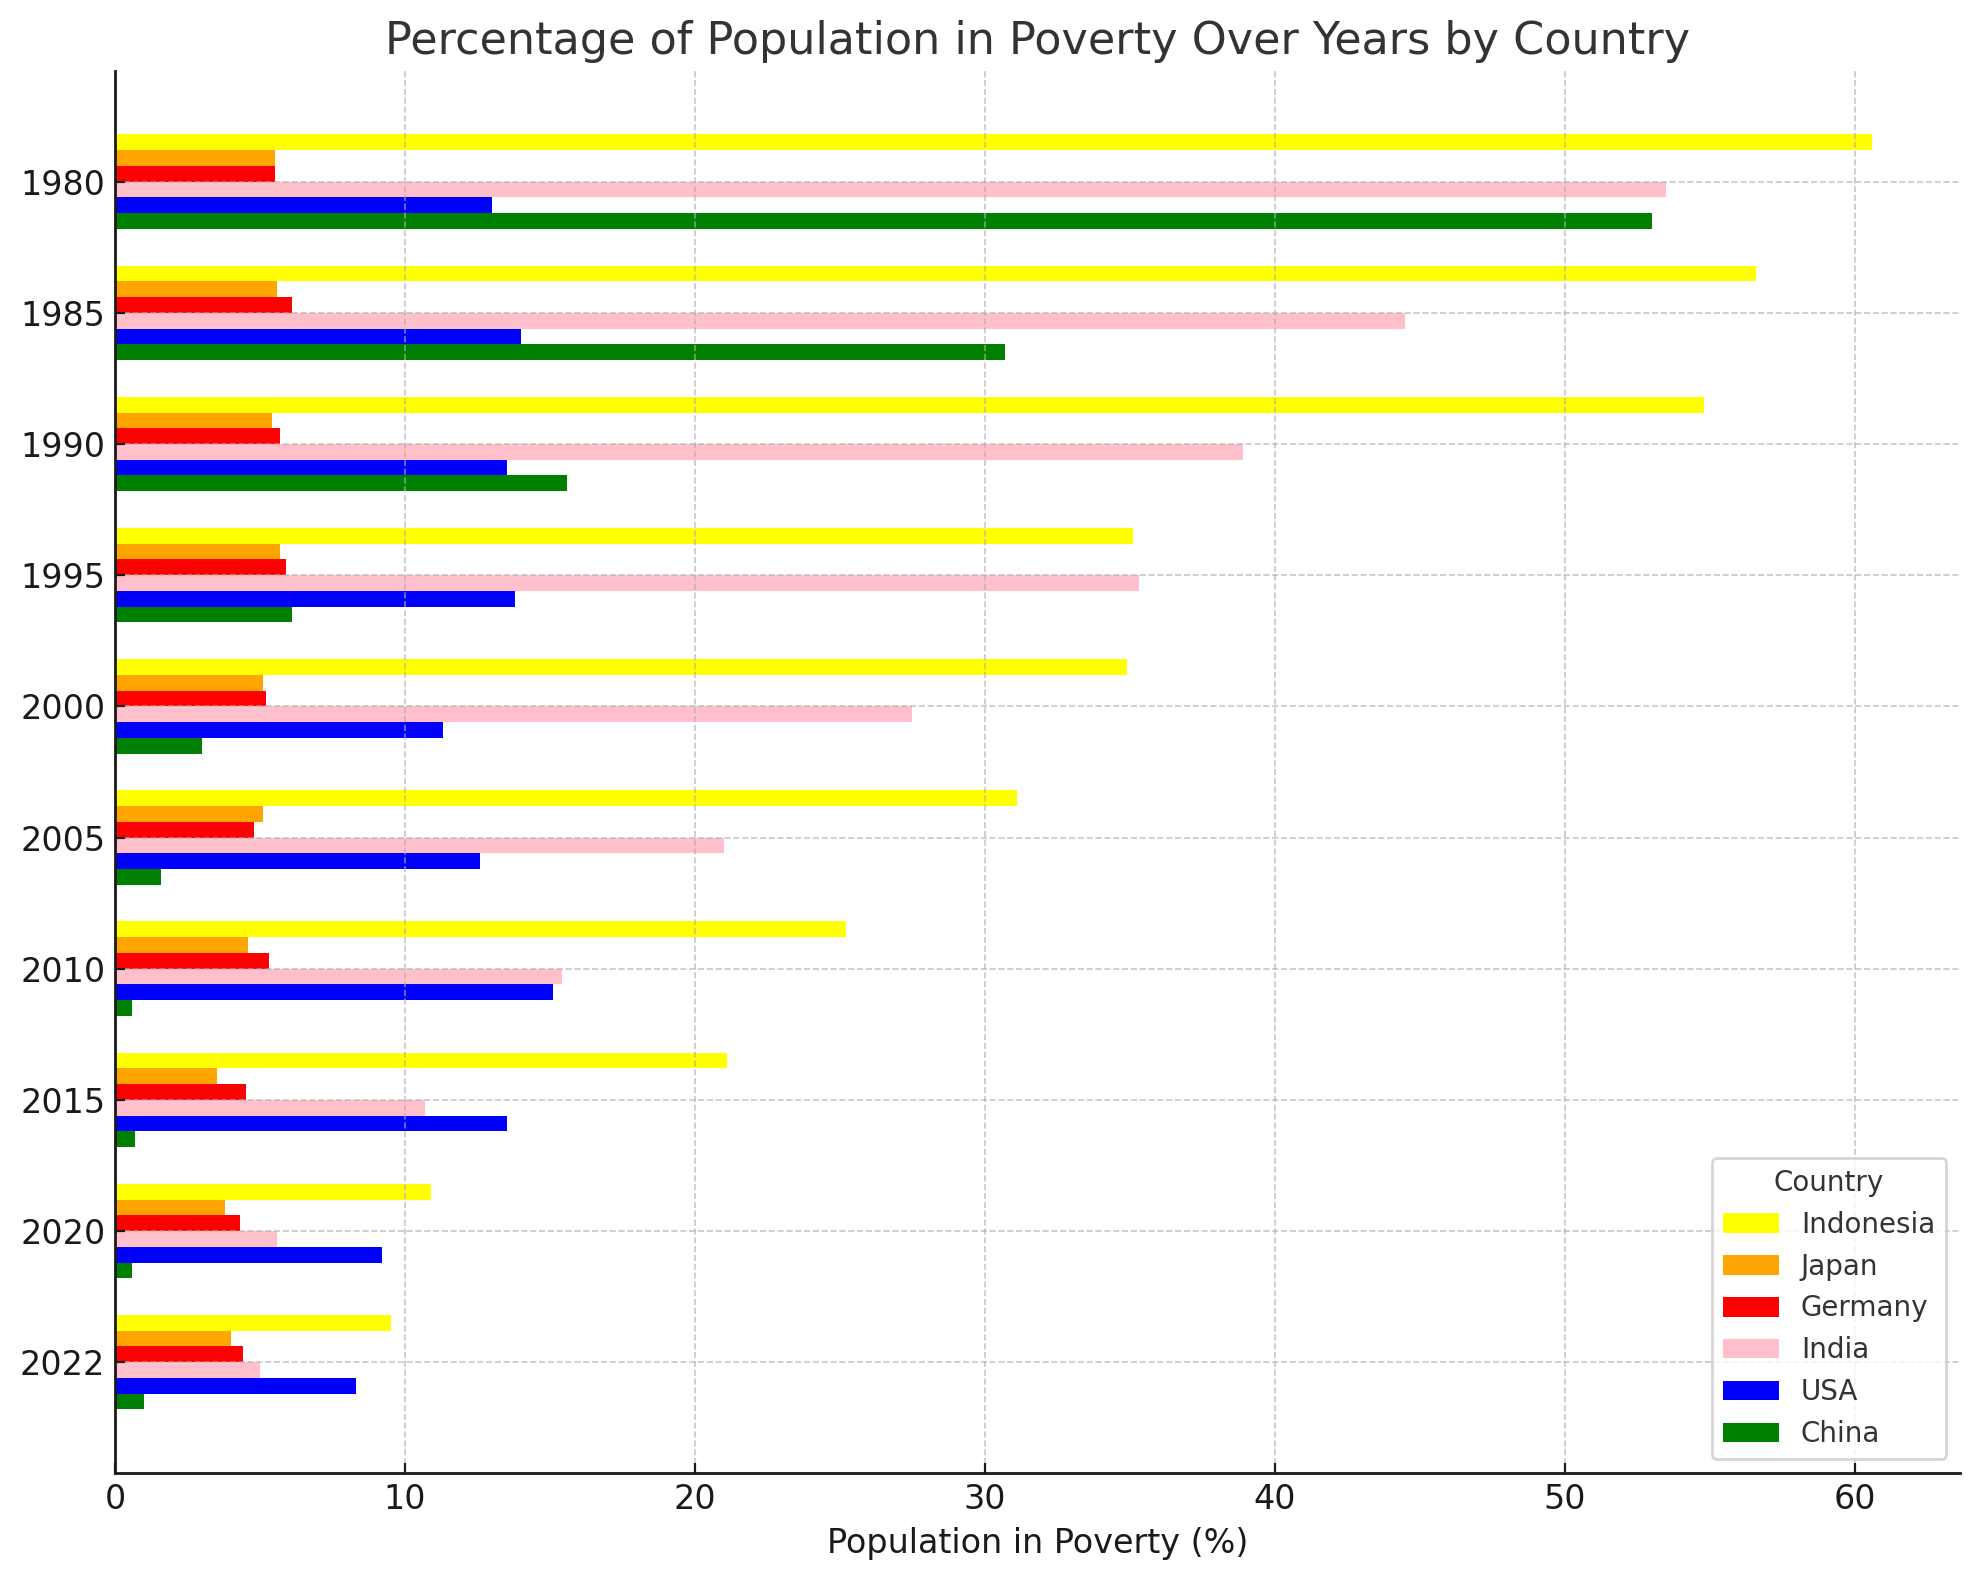
China has a large population. About 65% of the population live in cities (see graph-17 for urban population). The government spends a lot on education (see graph-10 for expenditure as percentage of GDP), health care (see graph-11 for infant mortality rate and graph-13 for life expectancy), and poverty alleviation (see graph-15 for percentage of population in poverty). In the last twenty years, the government has made lots of efforts in raising the household incomes in the rural area. They have been successful in reducing the income disparity between the rich and the poor (see graph-9 for GINI index). The country is on the right track to accomplish its goals for 2049.

Error: No feed found.
Please go to the Instagram Feed settings page to create a feed.
Press Enter / Return to begin your search.
New membership are not allowed.
9:30–6:00, Monday Until 8:00
2270 S Real Camino Lake California
The Loquet Museum fuels a journey of discovery across time to enable
solutions for a brighter future rich in nature and culture.